Qiying Ke1, Tianyuan Zhang2, Xuan Jin1, Xinming Li1, Yingjie Mei3, and Xianyue Quan1
1Department of Radiology, Zhujiang Hospital, Southern Medical University, Guangzhou, China, 2Department of Radiology, Foshan First People's Hospital, Foshan, China, 3Philips Healthcare, Guangzhou, China
1Department of Radiology, Zhujiang Hospital, Southern Medical University, Guangzhou, China, 2Department of Radiology, Foshan First People's Hospital, Foshan, China, 3Philips Healthcare, Guangzhou, China
Our study demonstrates that increased
MK and decreased ADC values are potential predictive biomarkers for of Ki-67
expression of in HCC.
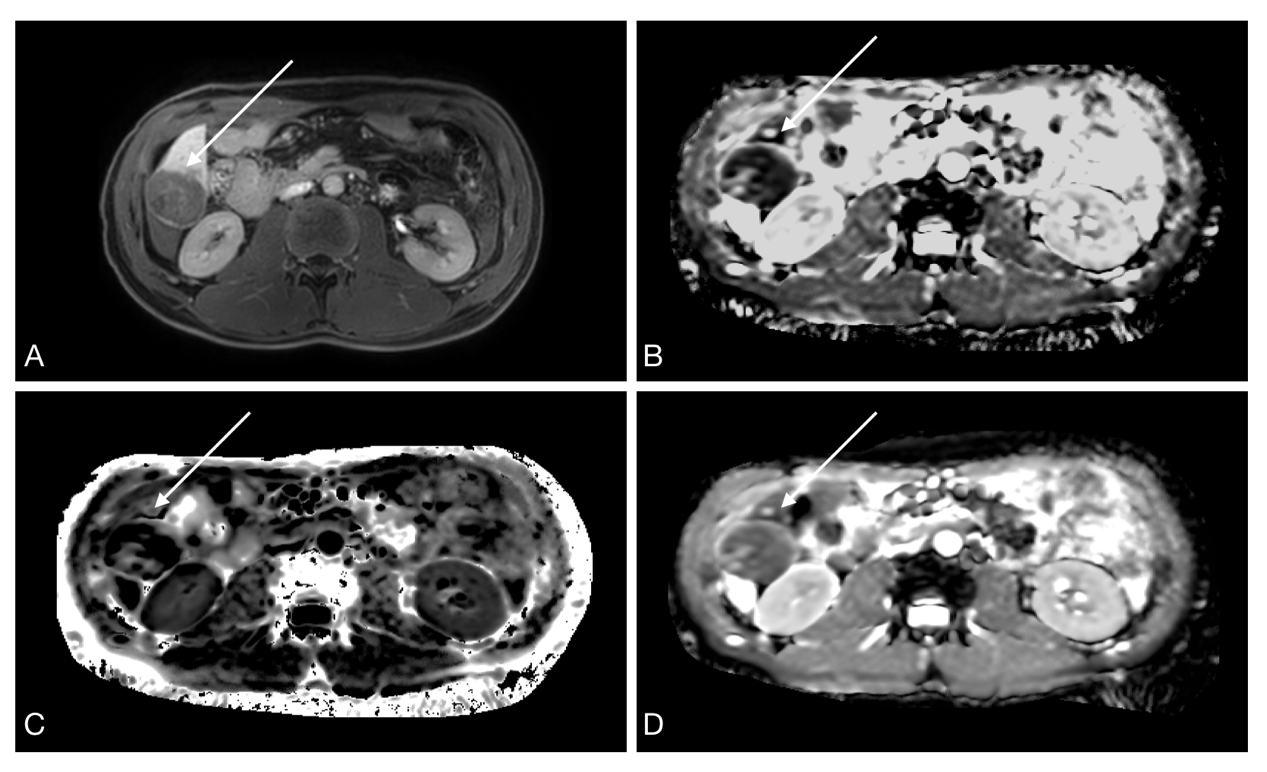
Figure 2. Images in a 36-year-old
man with HCC (arrow).
A,
Delayed phase image showing a heterogeneous low-signal intensity lesion in
segment VI of the liver.
B,
Diffusion map showing lower signal intensity compared with that of the liver
parenchyma. The mean diffusion value of the lesion was 1.35 x 10⁻³ mm2/sec.
C,
Kurtosis map showing higher signal intensity compared with that of the liver
parenchyma. The MK value of the lesion was 0.83.
D,
ADC map showing a lesion with a mean diffusion value of 1.18 x 10⁻³ mm2/sec.
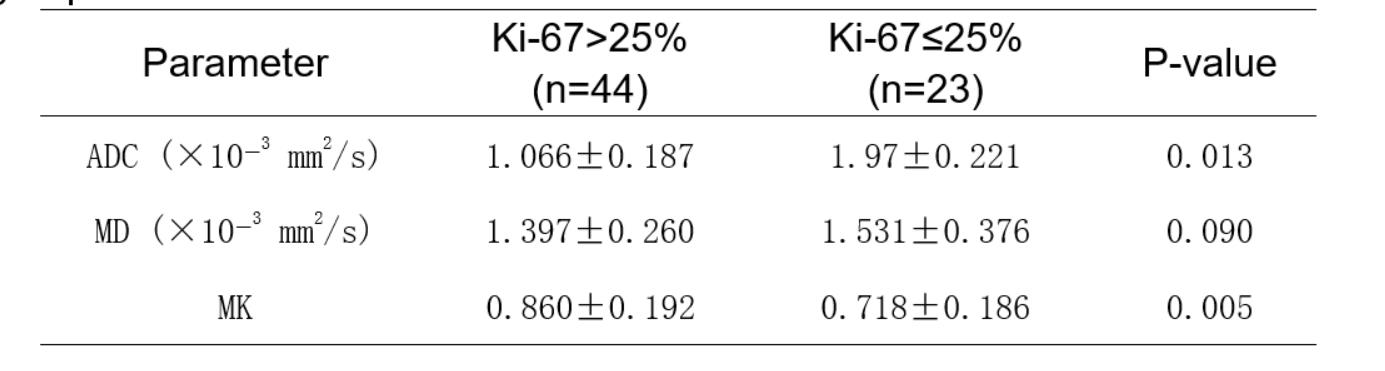
Table 1. Diffusion parameters in
HCC between the Ki-67>25% and Ki-67≤25% groups