Verena C. Obmann1, Damiano Catucci1, Annalisa Berzigotti2, Christoph Gräni3, Lukas Ebner1, Johannes Thomas Heverhagen1, Andreas Christe1, and Adrian Thomas Huber1
1Radiology, Inselspital, University of Bern, Bern, Switzerland, 2Visceral Surgery and Medicine, University of Bern, Inselspital, Bern, Switzerland, 3Cardiology, University of Bern, Inselspital, Bern, Switzerland
1Radiology, Inselspital, University of Bern, Bern, Switzerland, 2Visceral Surgery and Medicine, University of Bern, Inselspital, Bern, Switzerland, 3Cardiology, University of Bern, Inselspital, Bern, Switzerland
This is
the first study to show that T1 reduction rate may be interchangeably
calculated on MRI scans at 1.5T and 3T. It therefore represents a powerful
noninvasive imaging biomarker to determine liver function on liver.
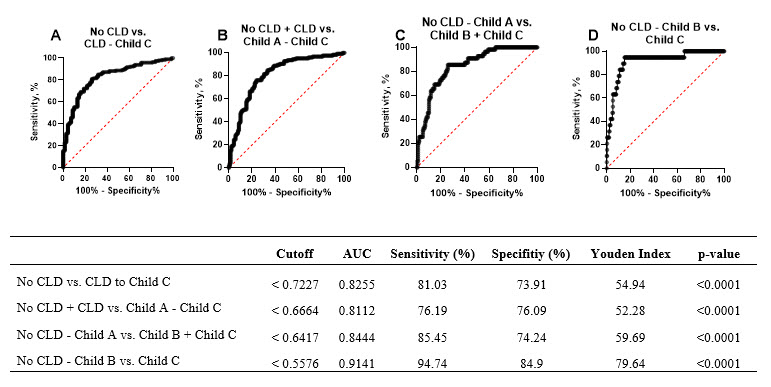
ROC curves for distinguishing between
patients without CLD, and CLD and cirrhosis on the basis of T1 reduction rates
at 1.5+3T are shown (A-D). AUC values for a given cutoff for each comparison as
well as the sensitivity, specificity and p-values are given. Cutoffs were determined
using the Youden Index, which is also shown.