Blanche Bapst1,2, Aurélien Massire3, Tobias Kober4,5,6, Gian Franco Piredda4,5,6, Bénédicte Maréchal4,5,6, and Pierre Brugières1
1Department of Neuroradiology, Henri Mondor Universitary Hospital, AP-HP, Créteil, France, 2Faculty of Medicine, Université Paris Est Créteil, Créteil, France, 3Siemens Healthcare SAS, Saint-Denis, France, 4Advanced Clinical Imaging Technology, Siemens Healthcare AG, Lausanne, Switzerland, 5Department of Radiology, Lausanne University Hospital and University of Lausanne, Lausanne, Switzerland, 6Signal Processing Laboratory (LTS 5), École Polytechnique Fédérale de Lausanne (EPFL), Lausanne, Switzerland
1Department of Neuroradiology, Henri Mondor Universitary Hospital, AP-HP, Créteil, France, 2Faculty of Medicine, Université Paris Est Créteil, Créteil, France, 3Siemens Healthcare SAS, Saint-Denis, France, 4Advanced Clinical Imaging Technology, Siemens Healthcare AG, Lausanne, Switzerland, 5Department of Radiology, Lausanne University Hospital and University of Lausanne, Lausanne, Switzerland, 6Signal Processing Laboratory (LTS 5), École Polytechnique Fédérale de Lausanne (EPFL), Lausanne, Switzerland
Compressed-sensing accelerated MP2RAGE provides robust and reliable brain segmentation and T1mapping using automated tools in a 29-patient cohort at 3 Tesla, when compared to the parallel imaging reference.
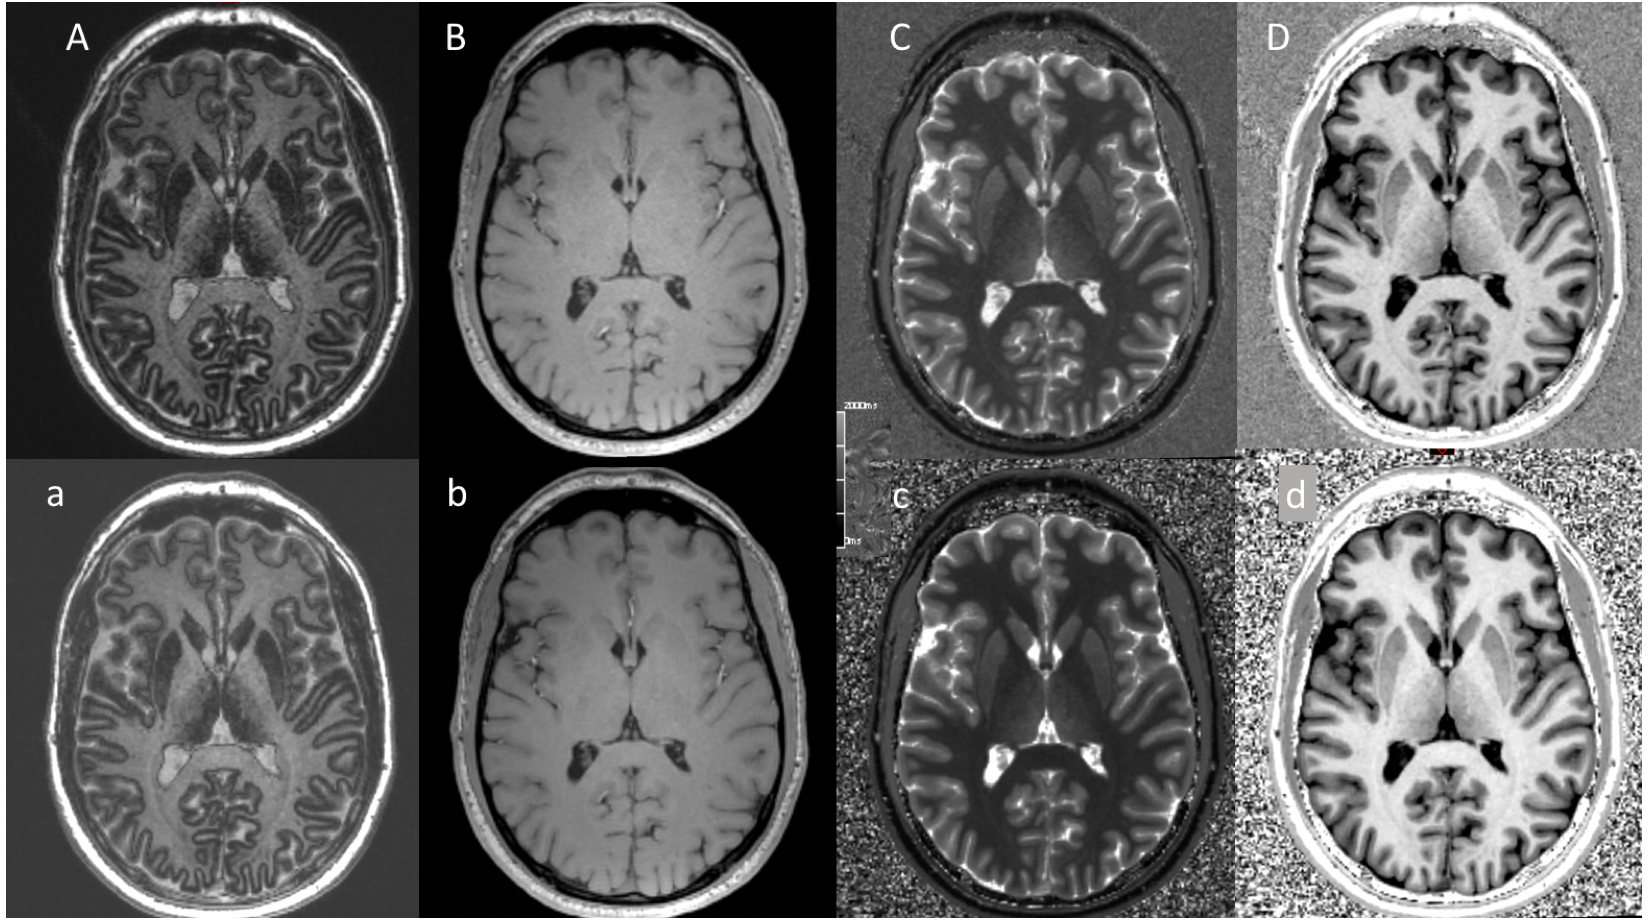
Figure 2: Example images in axial plane obtained from one patient. First inversion time image (INV1) (A: MP2RAGE, a: CS-MP2RAGE); second inversion time (INV2) (B: MP2RAGE, b: CS-MP2RAGE); T1map in ms (C: MP2RAGE, c: CS-MP2RAGE); UNI image (D: MP2RAGE, d: CS-MP2RAGE). Visual inspection confirmed preserved image quality for CS-MP2RAGE, with high GM/WM/CSF contrast and sharp structure delineation. On a side note, background noise distribution is different for CS-MP2RAGE.
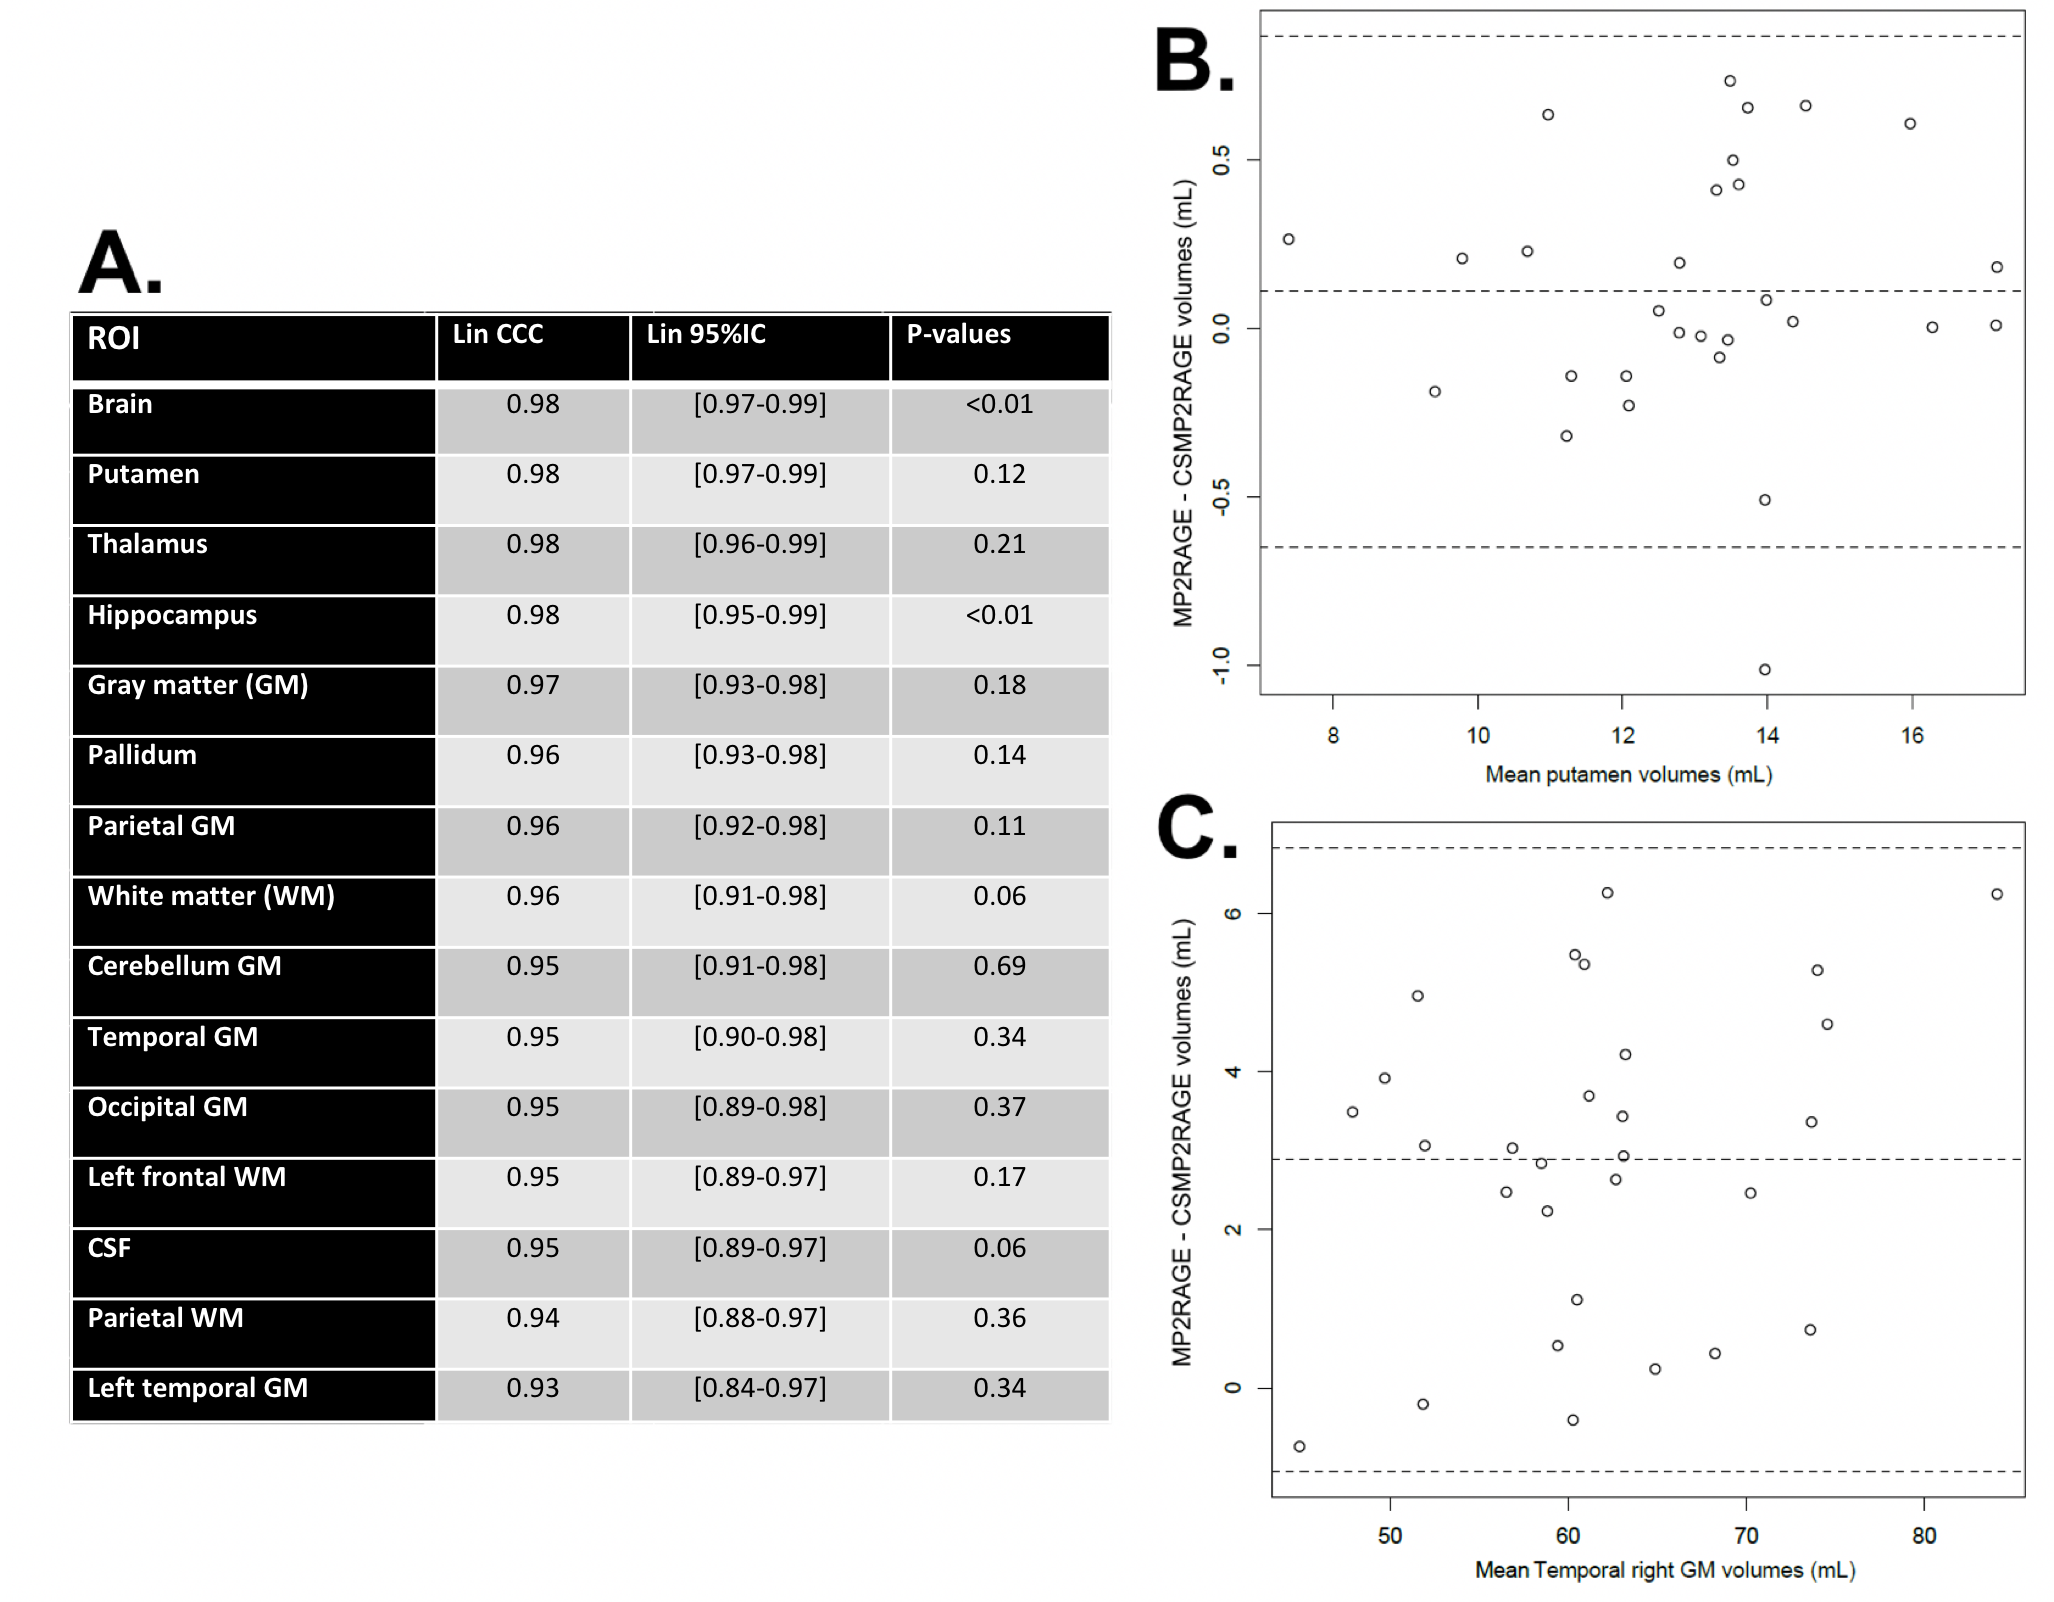
Figure 4: Comparisons of automated volumetric measurements (A) between conventional and CS-MP2RAGE, using Lin’s concordance correlation coefficients (CCC) and Wilcoxon p-values. Superior and inferior limit values accounting for 95% of individual coefficients are also provided to illustrate consistency within the cohort. Bland-Altman plots are shown for the best (putamen, B) and the worse (left temporal GM, C) correlations between measurements.