Evgeniya Kirilina1,2, Ilona Lipp1, Kerrin Pine1, Luke Edwards1, Carsten Jäger1,3, Kirsten Garus4, Markus Cremer4, Katrin Amunts4,5, and Nikolaus Weiskopf1,6
1Neurophysics, Max Planck Institute for Human Cognitive and Brain Sciences, Leipzig, Germany, 2Center for Cognitive Neuroscience Berlin, Freie Universität Berlin, Berlin, Germany, 3Paul Flechsig Institute of Brain Research, University of Leipzig, Leipzig, Germany, 4INM-1, Structural and Functional Organisation of the Brain, Forschungszentrum Juelich GmbH, Juelich, Germany, 5Cecile und Oskar Vogt Institute for Brain Research, Heinrich Heine University Duesseldorf, Duesseldorf, Germany, 6Felix Bloch Institute for Solid State Physics, Faculty of Physics and Earth Sciences, Leipzig University, Leipzig, Germany
1Neurophysics, Max Planck Institute for Human Cognitive and Brain Sciences, Leipzig, Germany, 2Center for Cognitive Neuroscience Berlin, Freie Universität Berlin, Berlin, Germany, 3Paul Flechsig Institute of Brain Research, University of Leipzig, Leipzig, Germany, 4INM-1, Structural and Functional Organisation of the Brain, Forschungszentrum Juelich GmbH, Juelich, Germany, 5Cecile und Oskar Vogt Institute for Brain Research, Heinrich Heine University Duesseldorf, Duesseldorf, Germany, 6Felix Bloch Institute for Solid State Physics, Faculty of Physics and Earth Sciences, Leipzig University, Leipzig, Germany
We present ultra-high resolution (≥ 300μm isotropic) quantitative multi-parameter maps acquired at 3T and 7T on a post-mortem human brain. The brain will be processed following the BigBrain atlasing procedures providing a whole brain histological analysis of cortical cytoarchitecture.
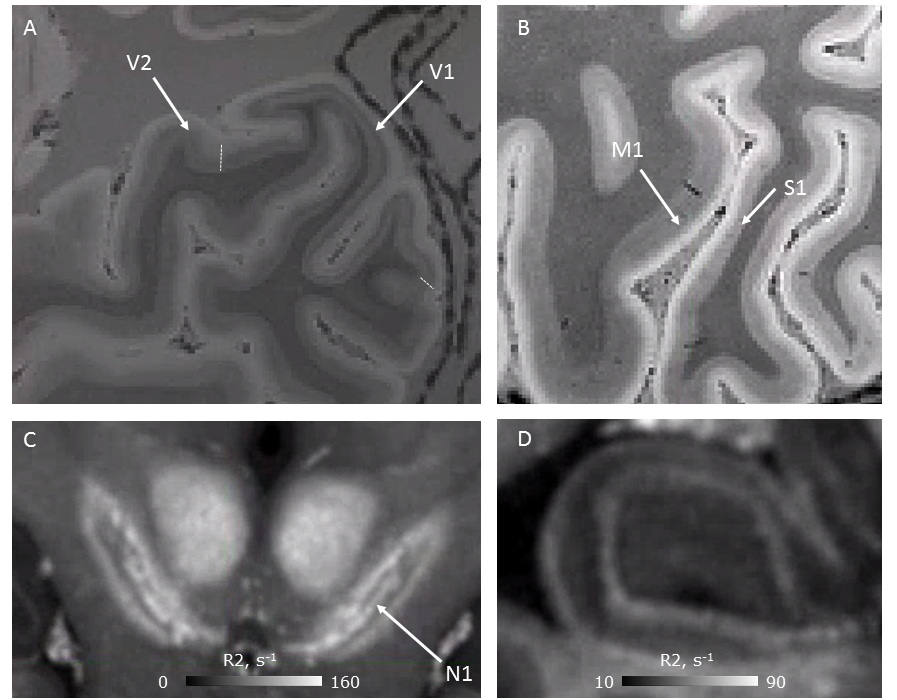
Figure 3. Ultrahigh-resolution qMRI maps allow visualisation of functional units with submillimeter size such as layers in the cortex (A,B), nuclei in subcortical areas (C), and substructures in hippocampus (D). (A) The stria of Gennari is visible in V1 and can be used to detect V1-V2 boundary; (B) Differences in cortical thickness and myelination are visible between primary motor (M1) and somatosensory area (S1); (C) Nigrosome 1 in substantia nigra appears bright in the R2* map. (D) Layers within the hippocampus are well delineated on R2* maps.
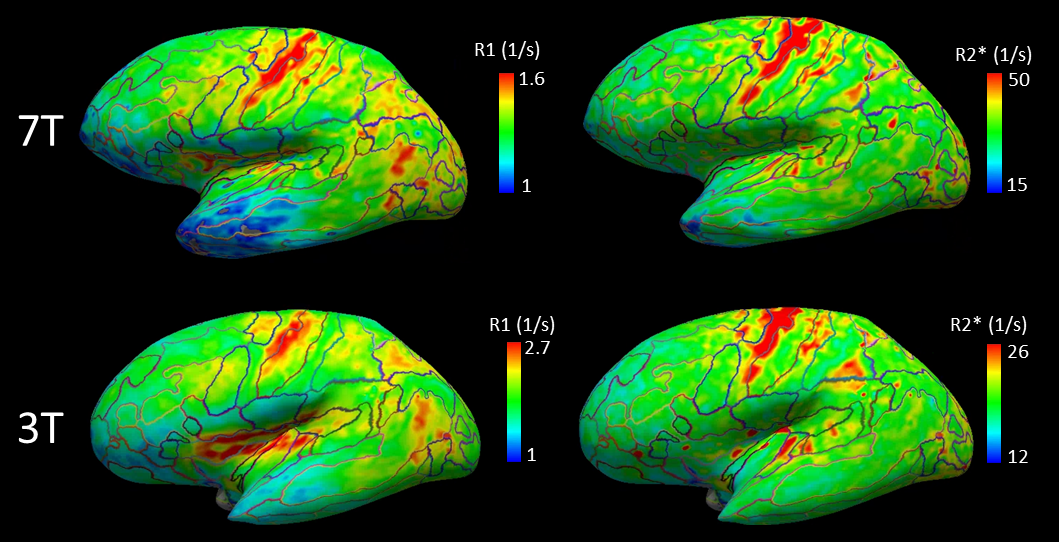
Figure 4. Quantitative maps of R1 (left) and R2* (right) at 7T (upper row) and 3T (bottom row) sampled from the mid-cortical surface. Regional variation in intracortical myelination reflects known histological features. The primary motor cortex shows the highest R2* and R1 values, followed by somatosensory and auditory areas. Frontal areas show lower R2* and R1 values in line with lower myelination of these areas. This demonstrates that acquired qMRI data provide sufficient quality for multimodal assessment of cortical myeloarchitecture across the brain.