Ingo Hermann1,2,3, Alena-Kathrin Golla1,3, Eloy Martinez-Heras4, Ralf Schmidt1, Elisabeth Solana4, Sara Llufriu4, Achim Gass5, Lothar Schad1, Sebastian Weingärtner2, and Frank Zöllner1,3
1Computer Assisted Clinical Medicine, Medical Faculty Mannheim, University Heidelberg, Mannheim, Germany, 2Magnetic Resonance Systems Lab, Department of Imaging Physics, Delft University of Technology, Delft, Netherlands, 3Mannheim Institute for Intelligent Systems in Medicine, Medical Faculty Mannheim, University Heidelberg, Mannheim, Germany, 4Center of Neuroimmunology, Laboratory of Advanced Imaging in Neuroimmunological Diseases, Hospital Clinic Barcelona, Universitat de Barcelona, Barcelona, Spain, 5Department of Neurology, Medical Faculty Mannheim, University Heidelberg, Mannheim, Germany
1Computer Assisted Clinical Medicine, Medical Faculty Mannheim, University Heidelberg, Mannheim, Germany, 2Magnetic Resonance Systems Lab, Department of Imaging Physics, Delft University of Technology, Delft, Netherlands, 3Mannheim Institute for Intelligent Systems in Medicine, Medical Faculty Mannheim, University Heidelberg, Mannheim, Germany, 4Center of Neuroimmunology, Laboratory of Advanced Imaging in Neuroimmunological Diseases, Hospital Clinic Barcelona, Universitat de Barcelona, Barcelona, Spain, 5Department of Neurology, Medical Faculty Mannheim, University Heidelberg, Mannheim, Germany
Deep learning regression network for the reconstruction of T1, T2*,
WM, GM and white matter lesion probability maps.
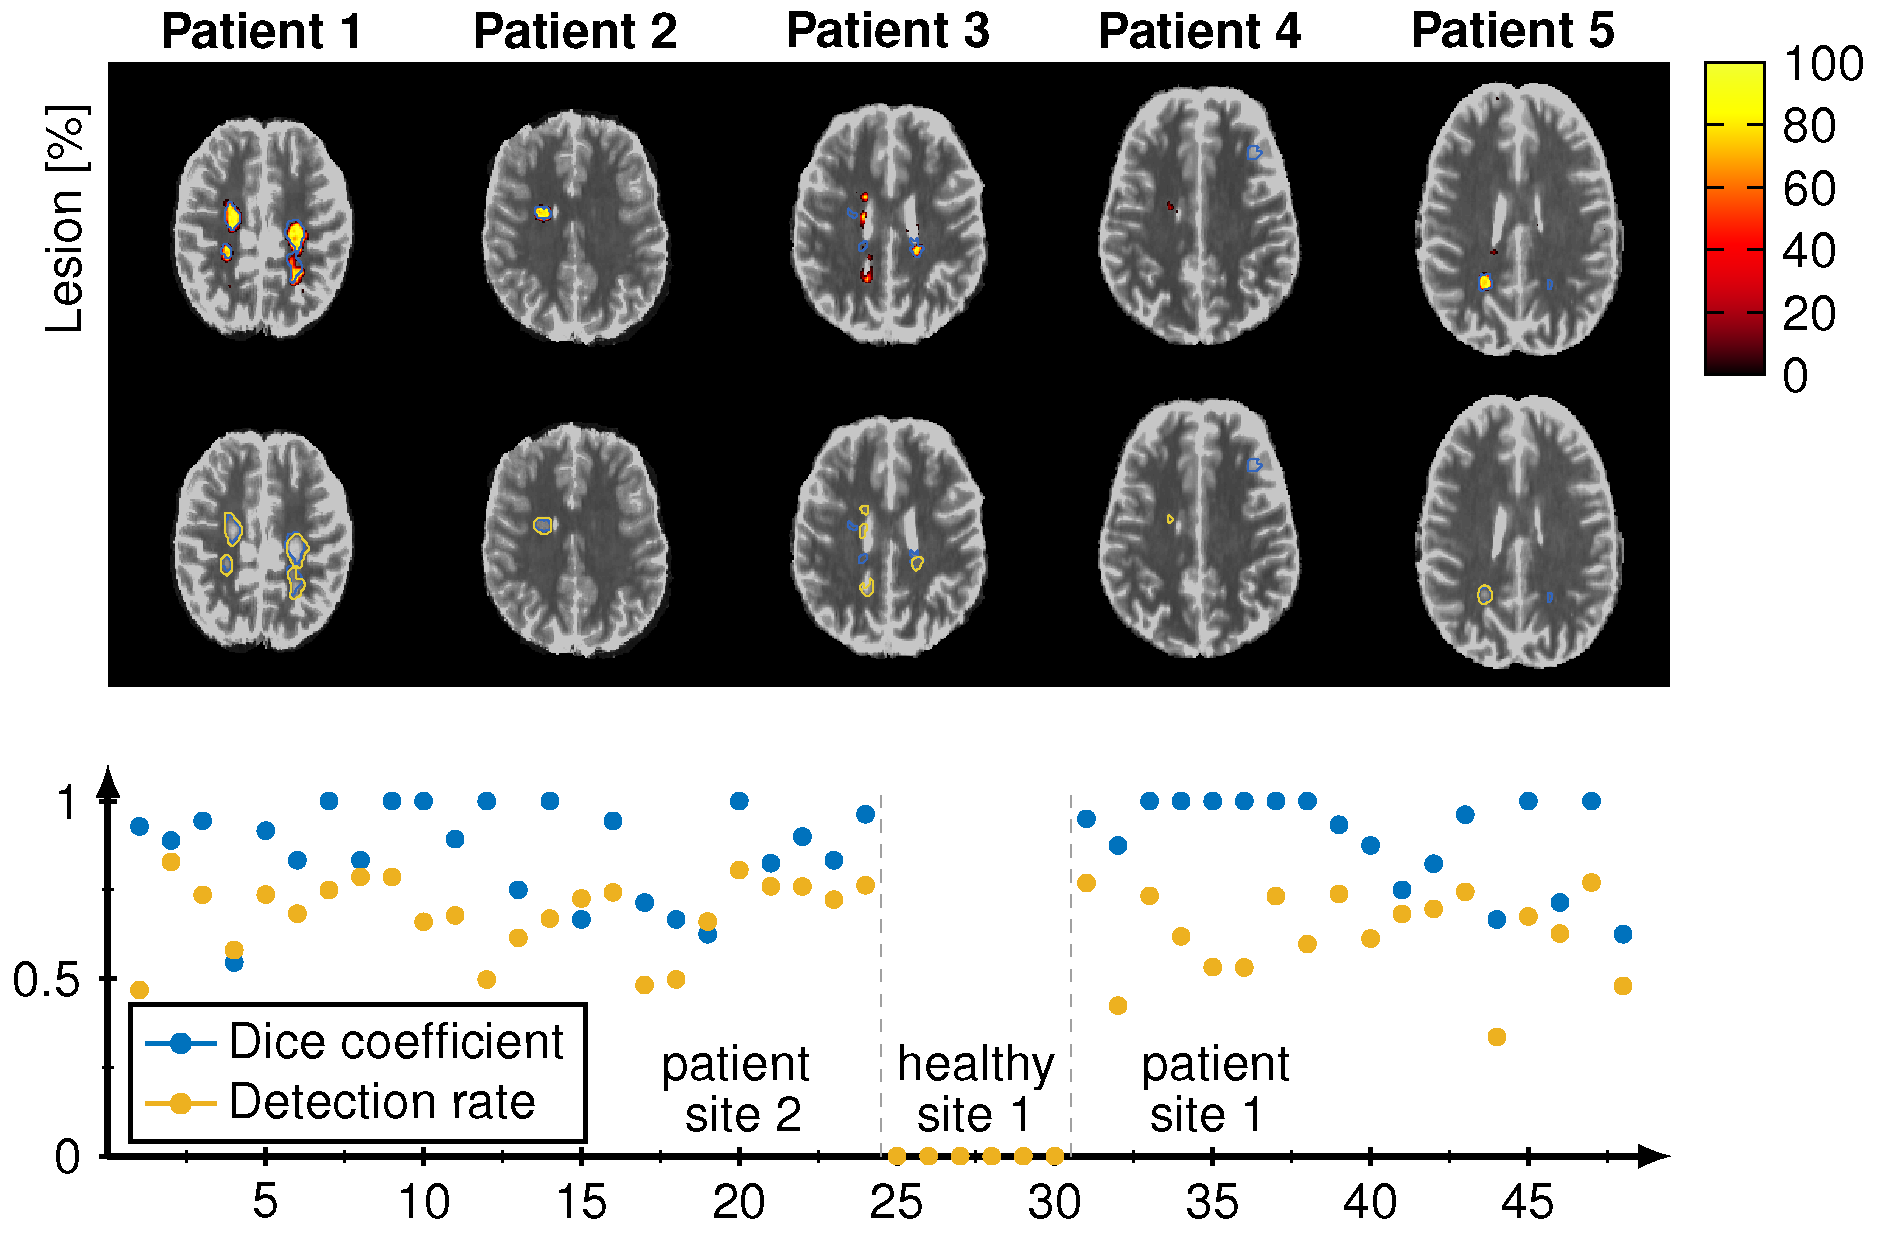
The reconstructed lesions probability maps are overlayed on the magnitude date in color encoding for all five different patients from the test set. Manual annotation is depicted in blue. Below the probability map is binarized and depicted in yellow in addition. The dice coefficient and white matter lesion detection rate is depicted for every patient and healthy subject for both sites. The average lesions detection rate is 0.83 and dice coefficient is 0.67 for all patients.
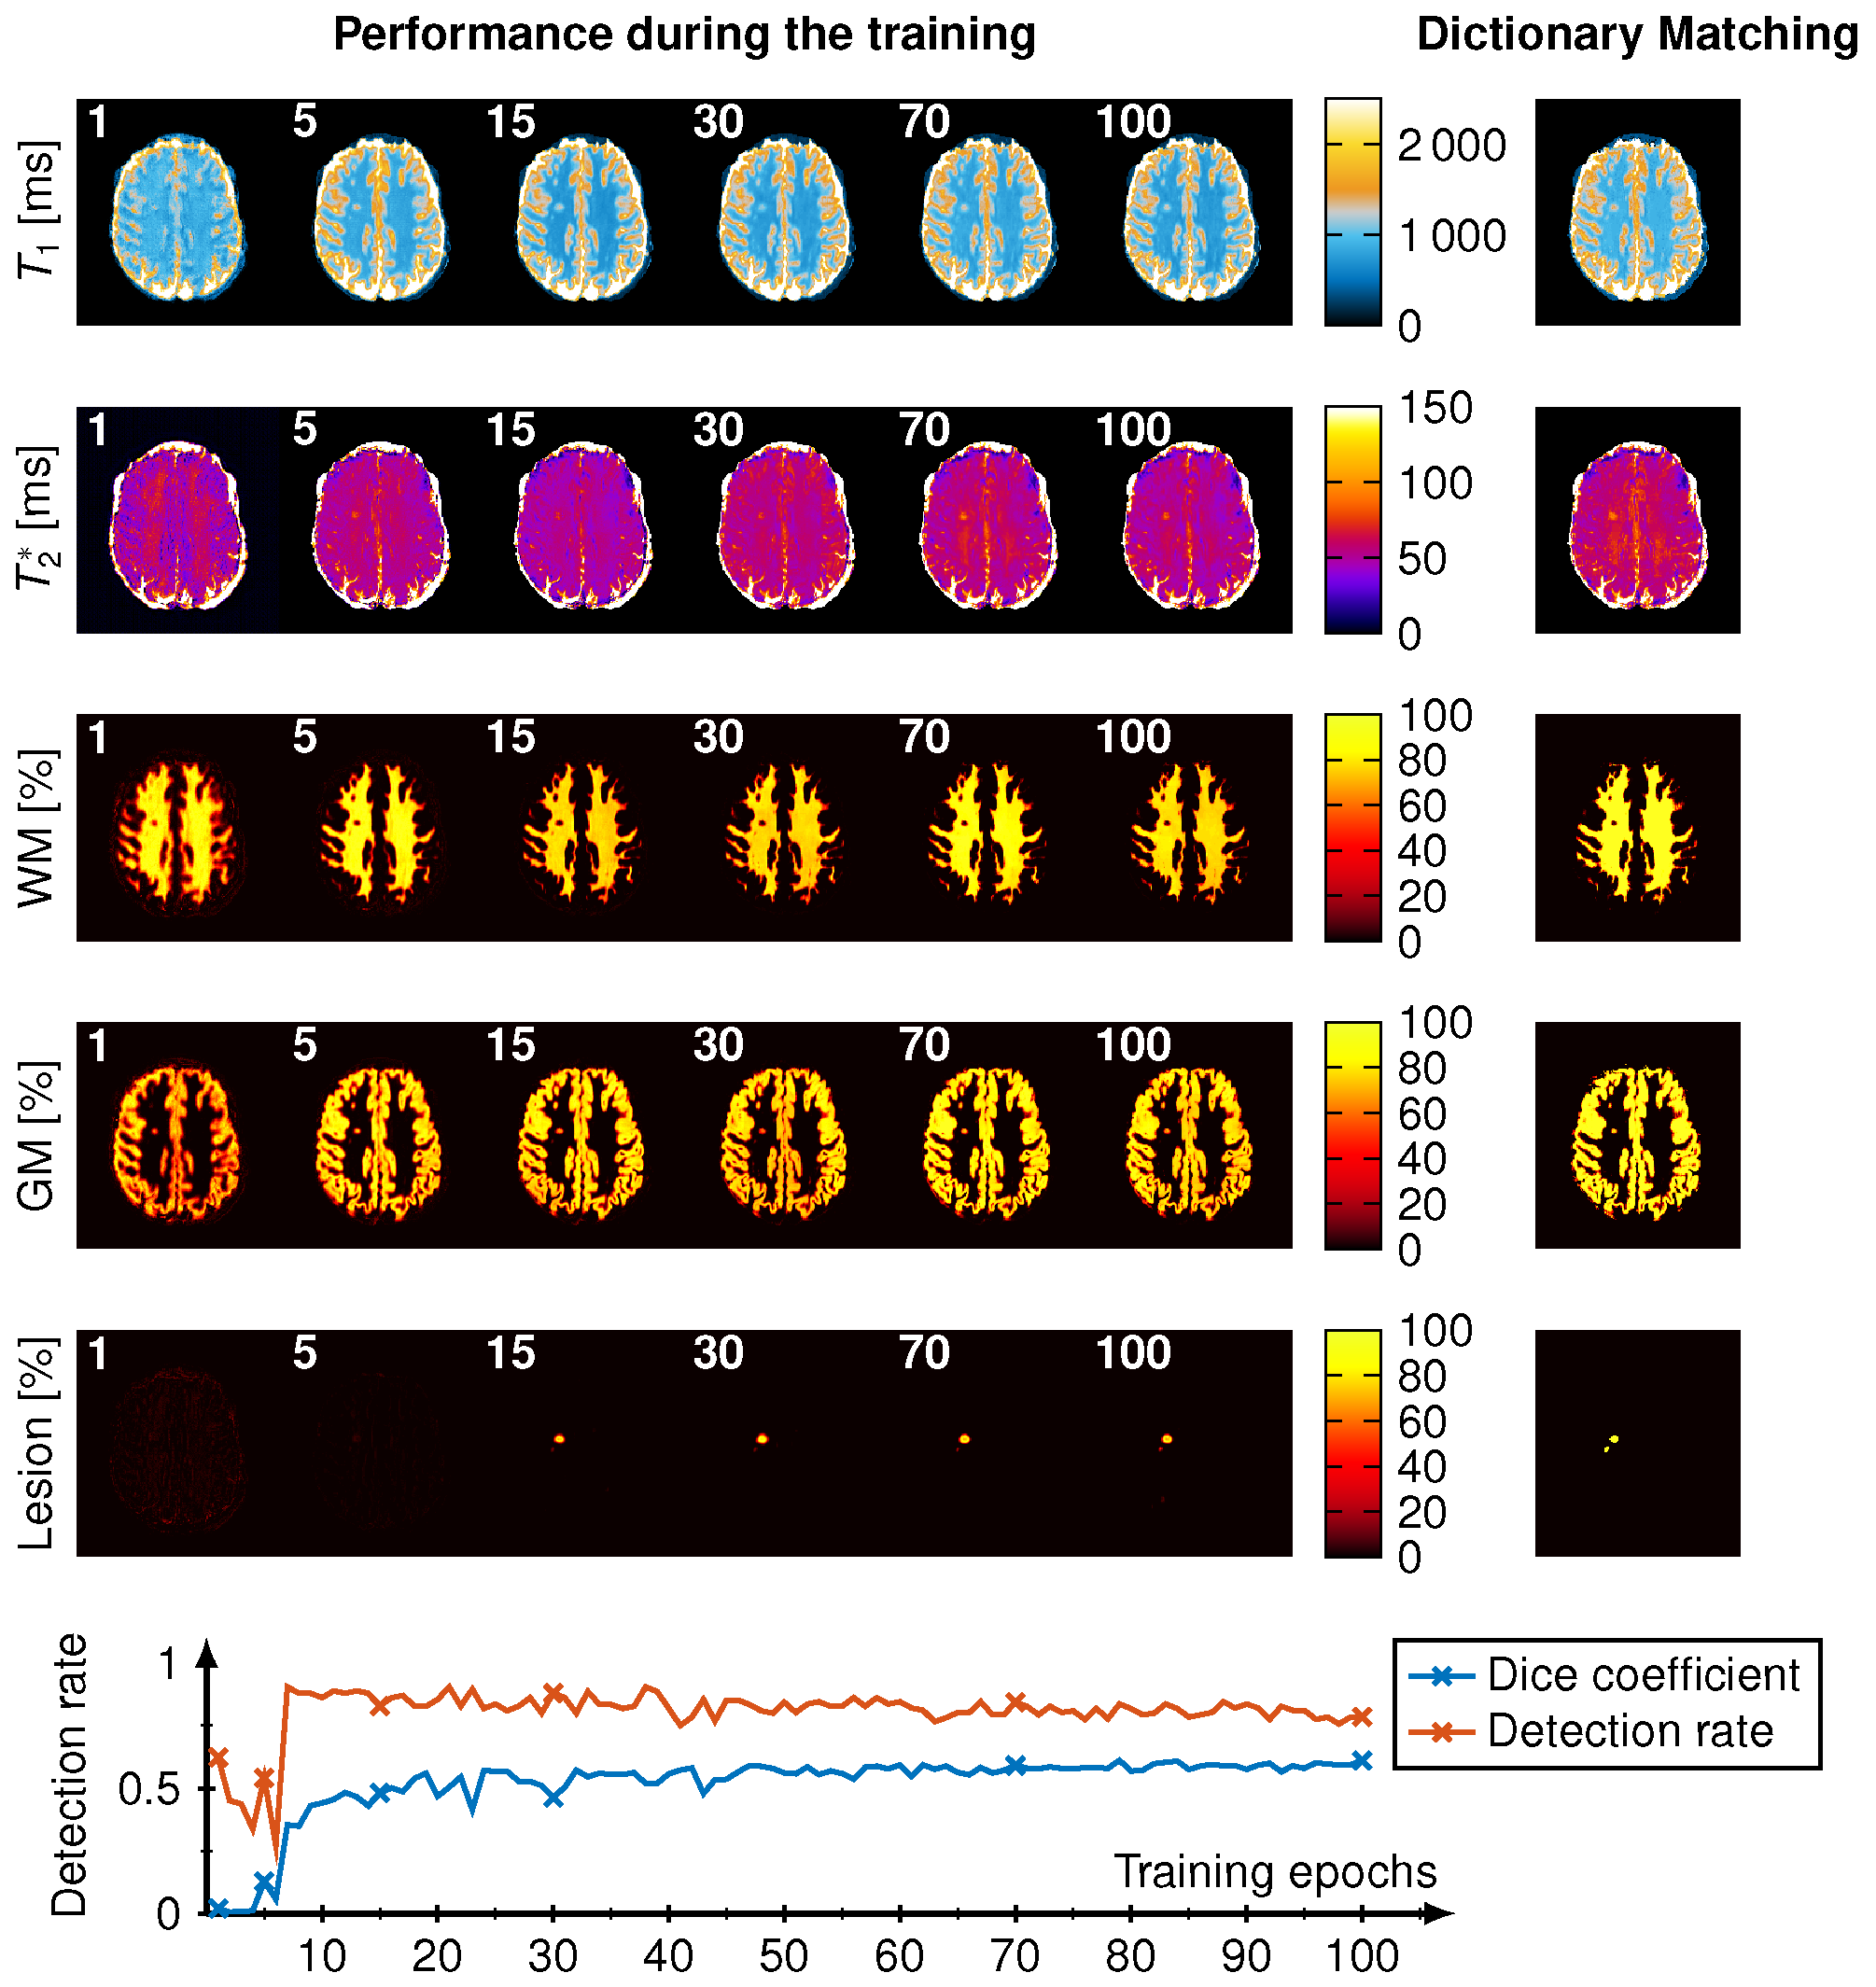
Visualization of the reconstruction during the training. The reconstructed T1, T2*, WM-, GM and Lesion-probability maps are depicted for 1, 5, 15, 30, 70 and 100 training epochs (white number) and the dictionary matching reference maps are shown on the right side. On the bottom the Dice coefficient (blue) and the lesion detection rate (orange) is depicted over the 50 training epochs.