Selda Yildiz1,2, Miranda M. Lim2,3,4,5,6, Manoj K. Sammi1,7, Katherine Powers1, Charles F. Murchison2,8, Jeffrey J. Iliff9,10,11,12,13, and William D. Rooney1,2,5,10
1Advanced Imaging Research Center, Oregon Health & Science University, Portland, OR, United States, 2Department of Neurology, Oregon Health & Science University, Portland, OR, United States, 3VA Portland Health Care System, Portland, OR, United States, 4Department of Medicine, Division of Pulmonary and Critical Care Medicine, Oregon Health & Science University, Portland, OR, United States, 5Department of Behavioral Neuroscience, Oregon Health & Science University, Portland, OR, United States, 6Oregon Institute of Occupational Health Sciences;, Oregon Health & Science University, Portland, OR, United States, 7BENFRA Botanical Dietary Supplements Research Center, Oregon Health & Science University, Portland, OR, United States, 8Department of Biostatistics, University of Alabama, Birmingham, AL, United States, 9Department of Anesthesiology and Perioperative Medicine, Oregon Health & Science University, Portland, OR, United States, 10Knight Cardiovascular Institute, Oregon Health & Science University, Portland, OR, United States, 11VISN 20 Mental Illness Research, Education and Clinical Center (MIRECC), VA Puget Sound Health Care System, Seattle, WA, United States, 12Department of Psychiatry and Behavioral Sciences, University of Washington, Seattle, WA, United States, 13Department of Neurology, University of Washington, Seattle, WA, United States
1Advanced Imaging Research Center, Oregon Health & Science University, Portland, OR, United States, 2Department of Neurology, Oregon Health & Science University, Portland, OR, United States, 3VA Portland Health Care System, Portland, OR, United States, 4Department of Medicine, Division of Pulmonary and Critical Care Medicine, Oregon Health & Science University, Portland, OR, United States, 5Department of Behavioral Neuroscience, Oregon Health & Science University, Portland, OR, United States, 6Oregon Institute of Occupational Health Sciences;, Oregon Health & Science University, Portland, OR, United States, 7BENFRA Botanical Dietary Supplements Research Center, Oregon Health & Science University, Portland, OR, United States, 8Department of Biostatistics, University of Alabama, Birmingham, AL, United States, 9Department of Anesthesiology and Perioperative Medicine, Oregon Health & Science University, Portland, OR, United States, 10Knight Cardiovascular Institute, Oregon Health & Science University, Portland, OR, United States, 11VISN 20 Mental Illness Research, Education and Clinical Center (MIRECC), VA Puget Sound Health Care System, Seattle, WA, United States, 12Department of Psychiatry and Behavioral Sciences, University of Washington, Seattle, WA, United States, 13Department of Neurology, University of Washington, Seattle, WA, United States
We present the first in-vivo demonstration of reductions in lactate levels and diffusivity during sleep versus wake in human brain. Findings, in consistent with invasive small-animal studies, support an altered lactate metabolism and/or increased glymphatics in sleeping human brain.
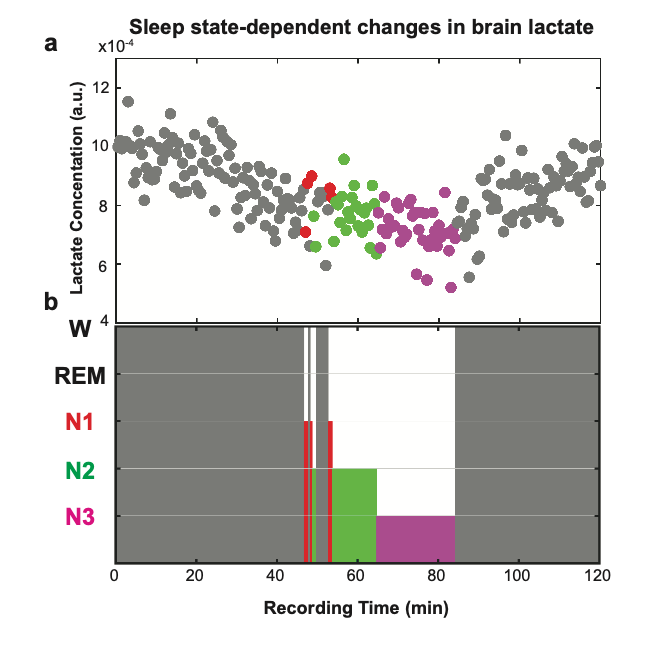
Figure 2. a) Subject 1: mean lactate concentration across sleep-wake cycles decline during sleep relative to wakefulness: 4.6 % in N1 (2.5 min), 12.0 % in N2 (12 min), and 18.0 % in N3. b) Representative sleep stages were visually scored for 30 s epochs and classified into: Wake (W), Non-REM sleep stage 1 (N1), Non-REM sleep stage 2 (N2), and Non-REM sleep stage 3 (N3).
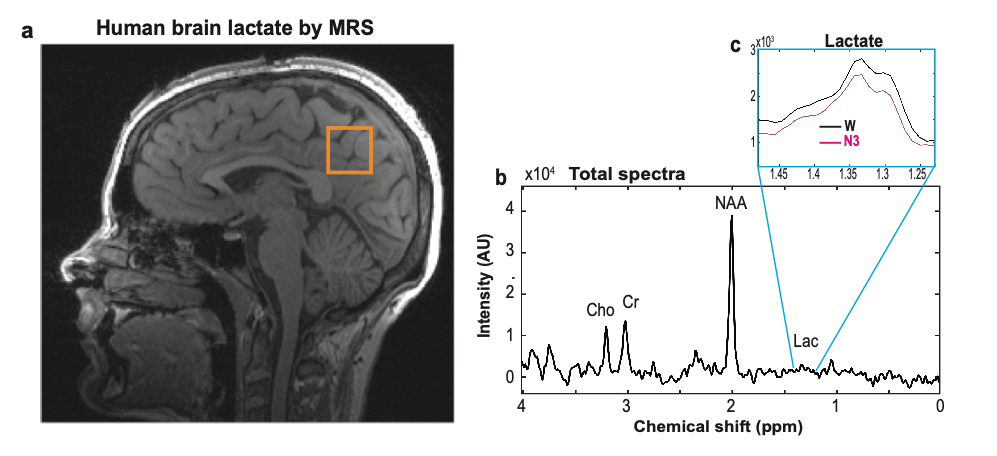
Figure 1. a) Measured single voxel (22 cm3, orange square) on a sagittal anatomical MR image of a 27-year old healthy young female (subject 1). b) A 7.5 sec 3T single voxel 1H-MR spectroscopy showing metabolites including lactate, c) Lactate concentrations, calculated within [1.23-1.48 ppm], are averaged over each sleep stage including Wake (W), non-REM stage 2 (N1), non-REM stage 2 (N2) and non-REM stage 3 (N3).