Theresia Ziegs1,2, Johanna Dorst1,2, and Anke Henning1,3
1MRZ, MPI for Biological Cybernetics, Tuebingen, Germany, 2IMPRS for Cognitive and Systems Neuroscience, Tuebingen, Germany, 3Advanced Imaging Research Center, University of Texas Southwestern Medical Center, Dallas, TX, United States
1MRZ, MPI for Biological Cybernetics, Tuebingen, Germany, 2IMPRS for Cognitive and Systems Neuroscience, Tuebingen, Germany, 3Advanced Imaging Research Center, University of Texas Southwestern Medical Center, Dallas, TX, United States
Labeling effects after oral
intake of [13C-1]glucose are observed
in humans using a 1H
MC-semiLASER sequence at 9.4 T. Spectral time series acquired in the frontal
cortex as well as the occipital lobe show labelling induced changes of Glu and Gln spectral pattern directly detected
with 1H MRS.
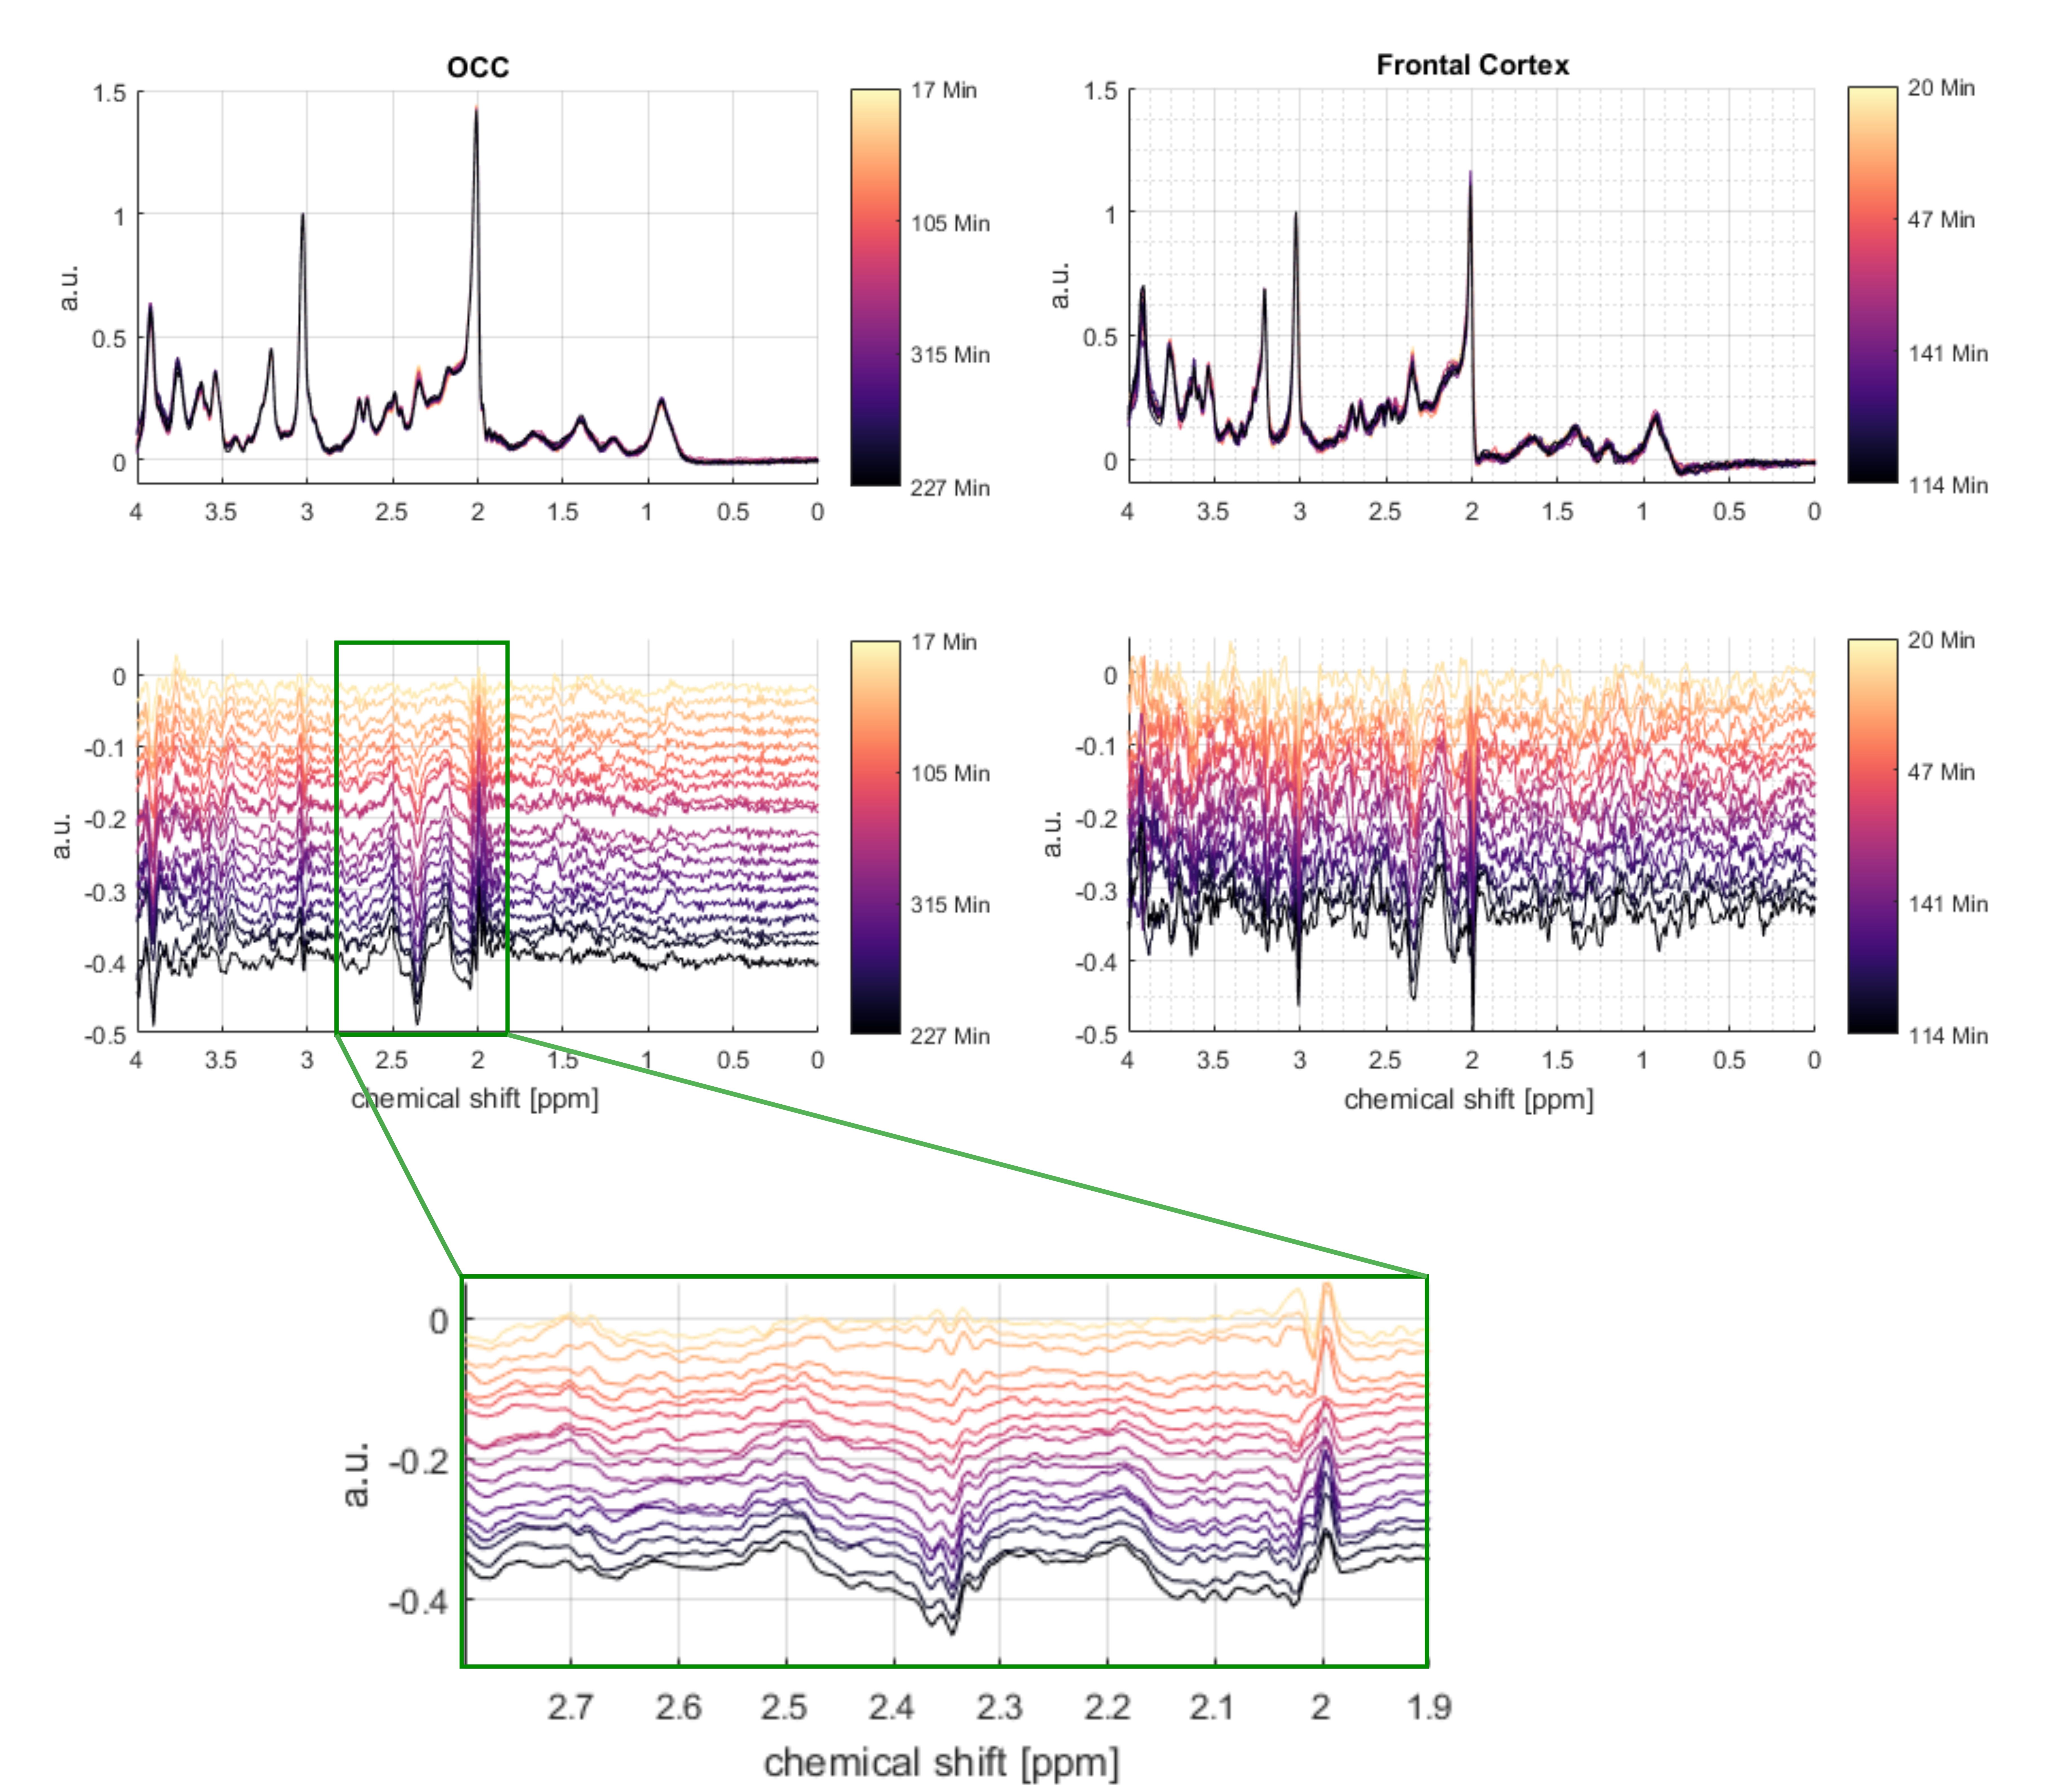
Figure 2: Time
series of the MC-semiLASER spectra from the occipital lobe (left) and frontal cortex (right)
and the corresponding difference spectra underneath. The difference spectra in
the spectral region of interest between 1.9 and 2.8 is zoomed in to make
changes more visible. The colorbar indicates the time of the (difference)
spectra after the glucose administration. Changes in the spectral region of NAA
and Cr can occur due to subtraction errors.
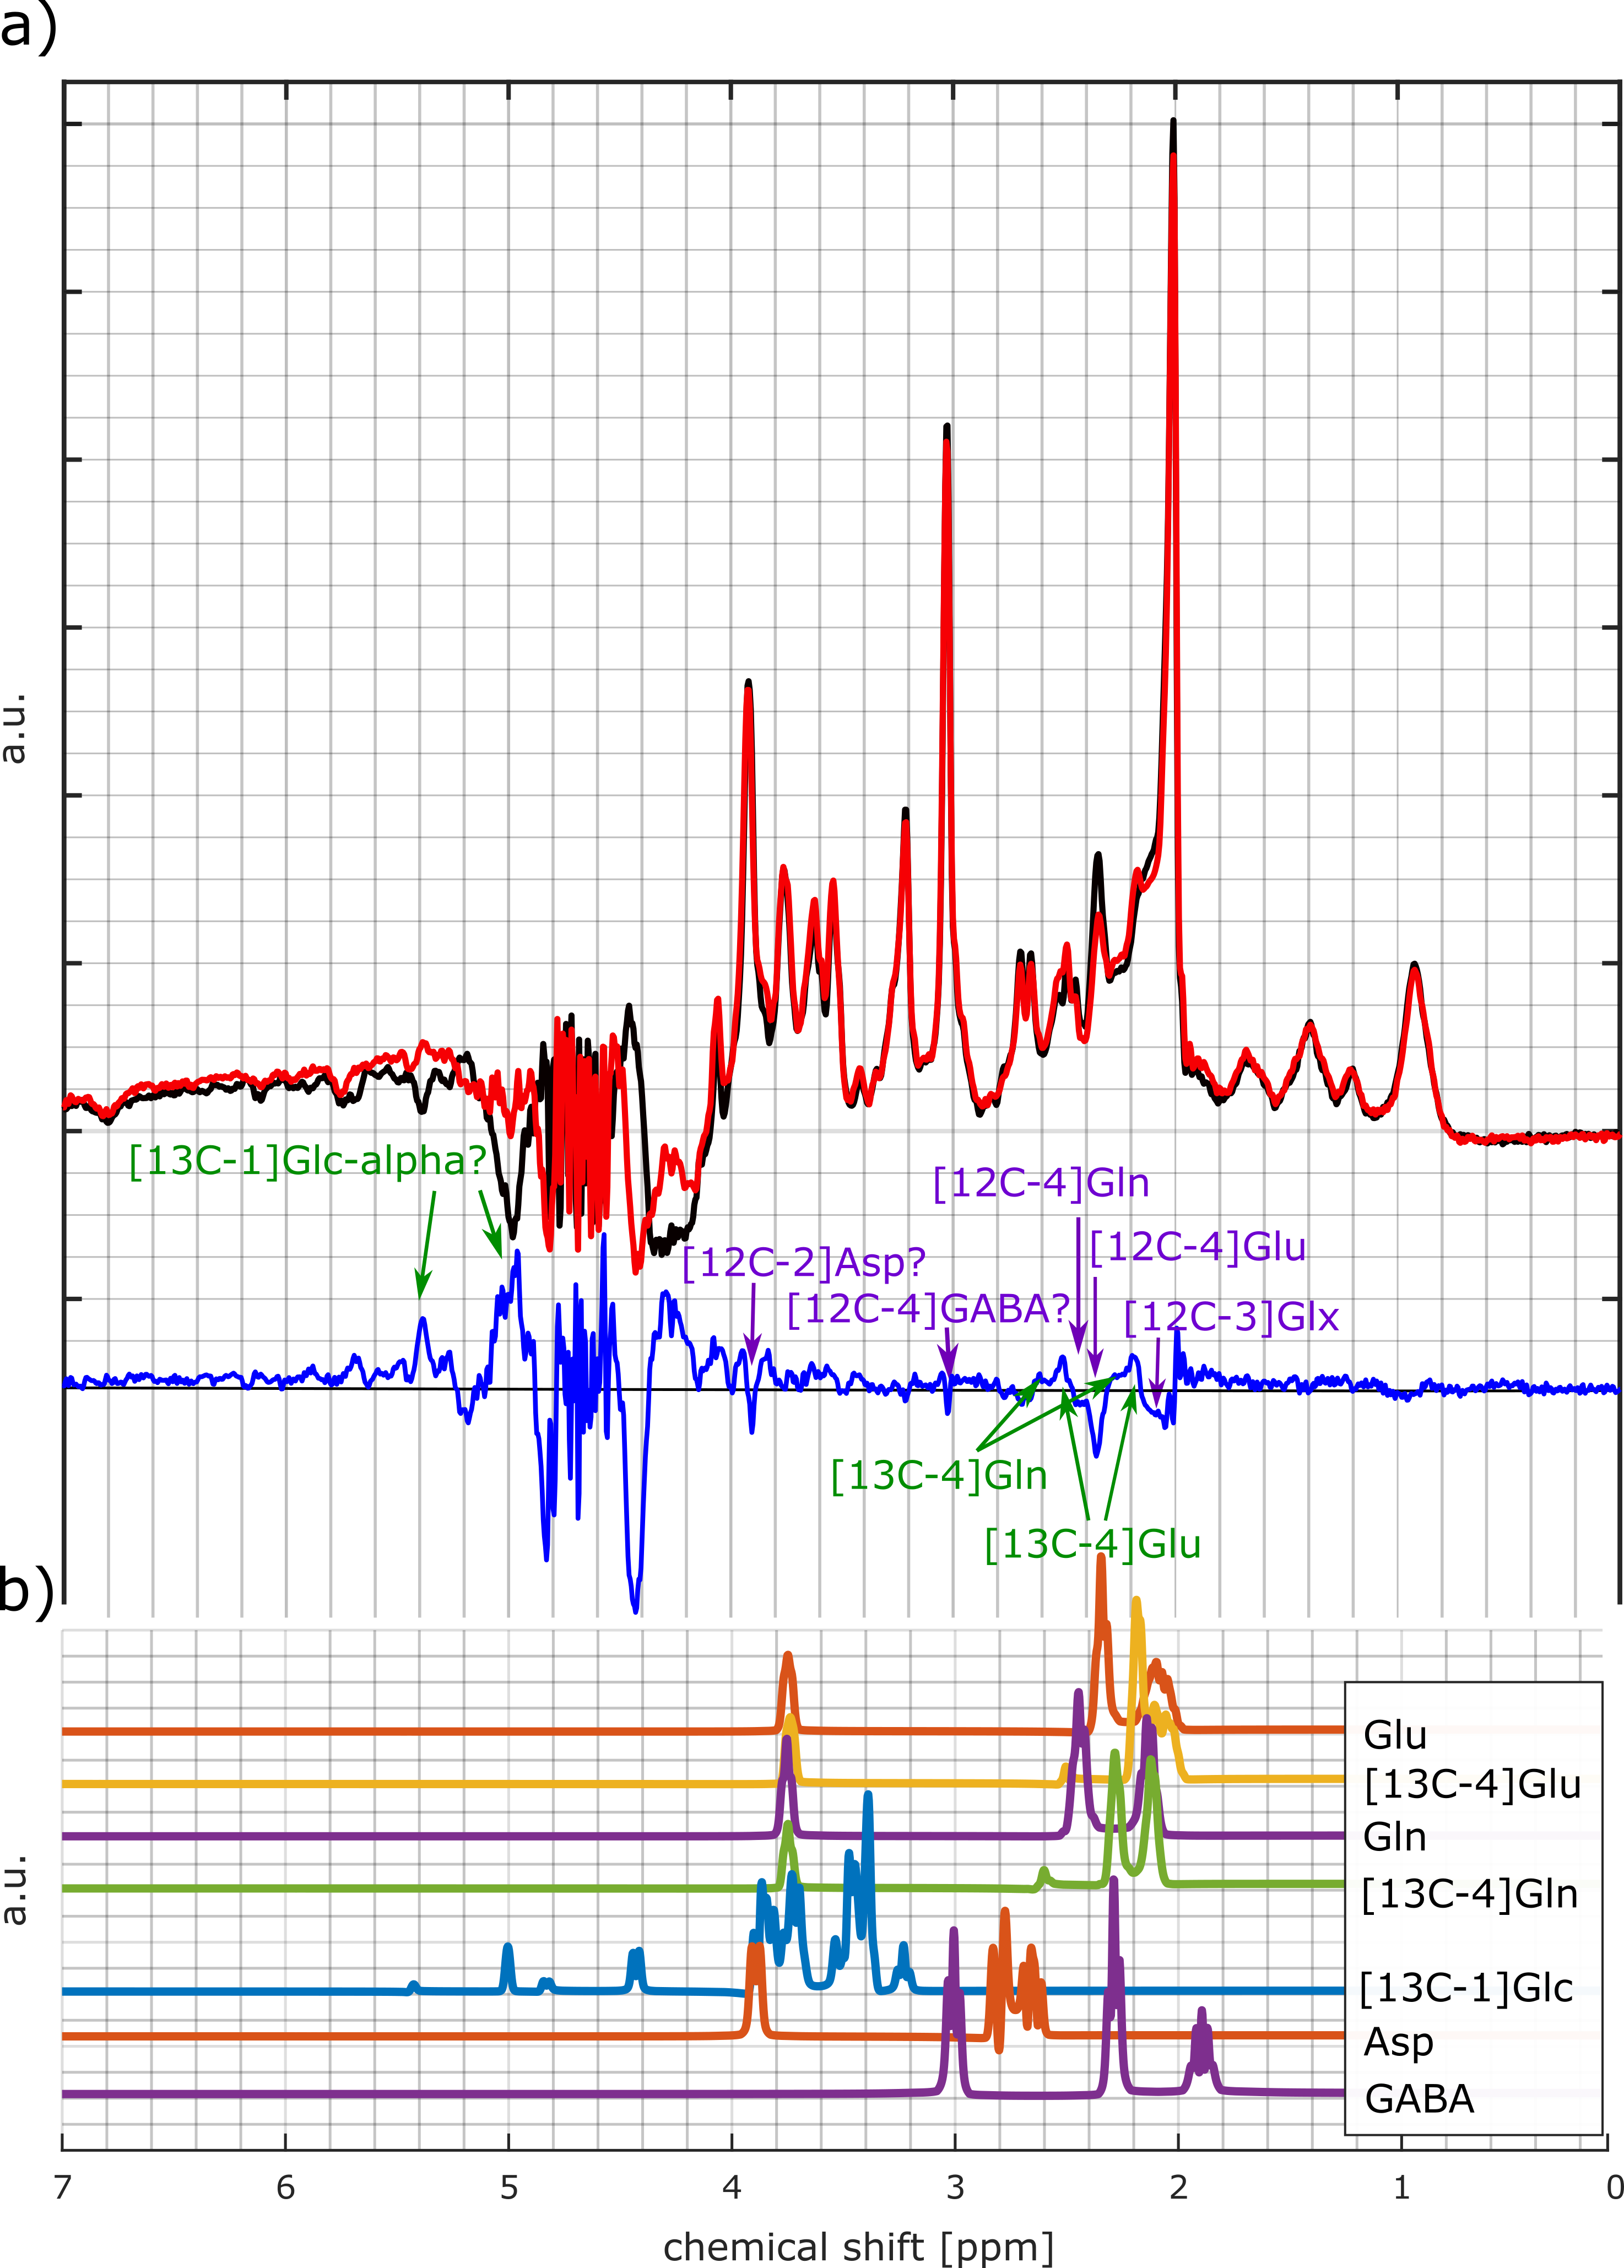
Figure 3: a) 1H MC-semiLaser
spectrum from one volunteer of the occipital lobe before glucose administration
(black line) and 127 minutes after the administration (red line) and the
difference spectrum (blue line). Obvious peak changes are marked: Decreasing
peaks are marked in purple and increasing peaks are marked in green. The
spectra contain 64 averages. b) Simulated spectra for selected metabolites and
labeled metabolites.