Anna M Chen1, Teresa Gerhalter1, Seena Dehkharghani1,2, Rosemary Peralta1, Fatemeh Adlparvar1, Martin Gajdošík3, Mickael Tordjman1,4, Julia Zabludovsky1, Sulaiman Sheriff5, James S Babb1, Tamara Bushnik6, Jonathan M Silver7, Brian S Im6, Stephen P Wall8, Guillaume Madelin1, and Ivan I Kirov1,2,9
1Center for Biomedical Imaging, Department of Radiology, New York University Grossman School of Medicine, New York, NY, United States, 2Department of Neurology, New York University Grossman School of Medicine, New York, NY, United States, 3Department of Biomedical Engineering, Columbia University School of Engineering and Applied Science, New York, NY, United States, 4Department of Radiology, Cochin Hospital, Paris, France, 5Department of Radiology, University of Miami Miller School of Medicine, Miami, FL, United States, 6Department of Rehabilitation Medicine, New York University Grossman School of Medicine, New York, NY, United States, 7Department of Psychiatry, New York University Grossman School of Medicine, New York, NY, United States, 8Ronald O. Perelman Department of Emergency Medicine, New York University Grossman School of Medicine, New York, NY, United States, 9Center for Advanced Imaging Innovation and Research, Department of Radiology, New York University Grossman School of Medicine, New York, NY, United States
1Center for Biomedical Imaging, Department of Radiology, New York University Grossman School of Medicine, New York, NY, United States, 2Department of Neurology, New York University Grossman School of Medicine, New York, NY, United States, 3Department of Biomedical Engineering, Columbia University School of Engineering and Applied Science, New York, NY, United States, 4Department of Radiology, Cochin Hospital, Paris, France, 5Department of Radiology, University of Miami Miller School of Medicine, Miami, FL, United States, 6Department of Rehabilitation Medicine, New York University Grossman School of Medicine, New York, NY, United States, 7Department of Psychiatry, New York University Grossman School of Medicine, New York, NY, United States, 8Ronald O. Perelman Department of Emergency Medicine, New York University Grossman School of Medicine, New York, NY, United States, 9Center for Advanced Imaging Innovation and Research, Department of Radiology, New York University Grossman School of Medicine, New York, NY, United States
Lobar linear regression analysis yielded higher Cho, Cr and mI in WM in mTBI patients compared to controls. No group differences for NAA were found in WM, nor for any metabolites in GM. Associations were detected between metabolites and symptoms in WM, and between metabolites and cognition in GM.
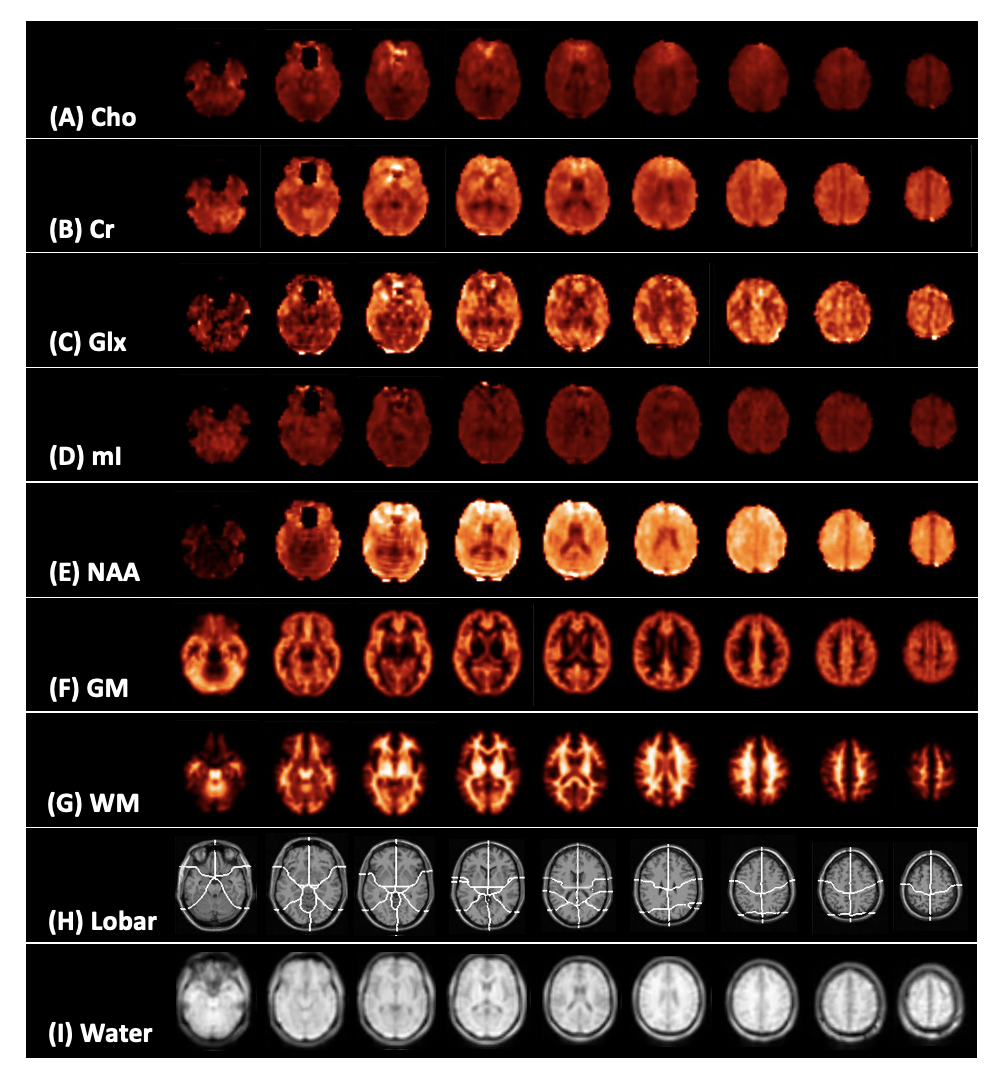
Figure 1: Representative spectroscopic map images for a single control subject. Presented is every fifth slice from the volumetric data for (A) creatine (Cr), (B) choline (Cho), (C) myo-inositol (mI), (D) glutamate plus glutamine (Glx), (E) N-acetyl aspartate (NAA), (F) grey and (G) white matter segmentation (GM, WM), (H) lobar parcellation, and (I) water (used as quantification reference) at the spectroscopic image spatial resolution.
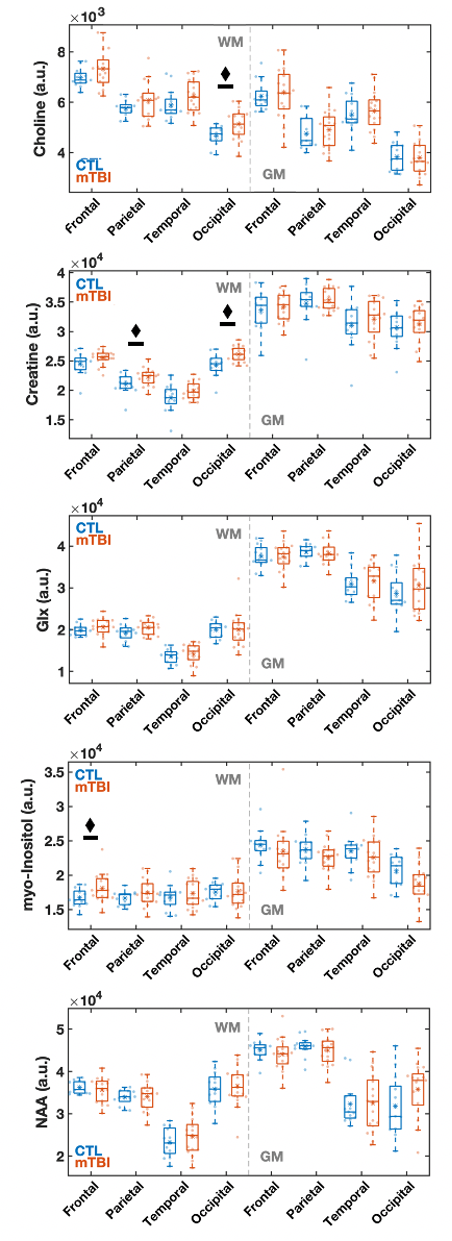
Figure 3: Boxplots of lobar metabolite distributions within mTBI and control (CTL) cohorts. Occipital WM Cho and Cr, parietal WM Cr, and frontal WM mI are higher in mTBI patients compared to controls (MW, ♦: p 0.05). Note that in all lobes WM Cr and Cho medians are higher in mTBI patients compared to controls. Cho: choline, Cr: creatine, mI: myo-inositol, Glx: glutamine plus glutamate; NAA: N-acetyl aspartate; WM: white matter.