Guglielmo Genovese1, Dinesh K. Deelchand1, Melissa Terpstra1, and Malgorzata Marjanska1
1Center for Magnetic Resonance Research (CMRR), Department of Radiology, University of Minnesota, Minneapolis, MN, United States
1Center for Magnetic Resonance Research (CMRR), Department of Radiology, University of Minnesota, Minneapolis, MN, United States
- LCModel accurately quantifies alterations in [GABA] using measured macromolecules, stiff baseline and no concentration ratio priors.
- Reducing SNR increased standard deviation across subjects.
- The 10% [GABA] group differences could be observed with reasonable sample sizes.
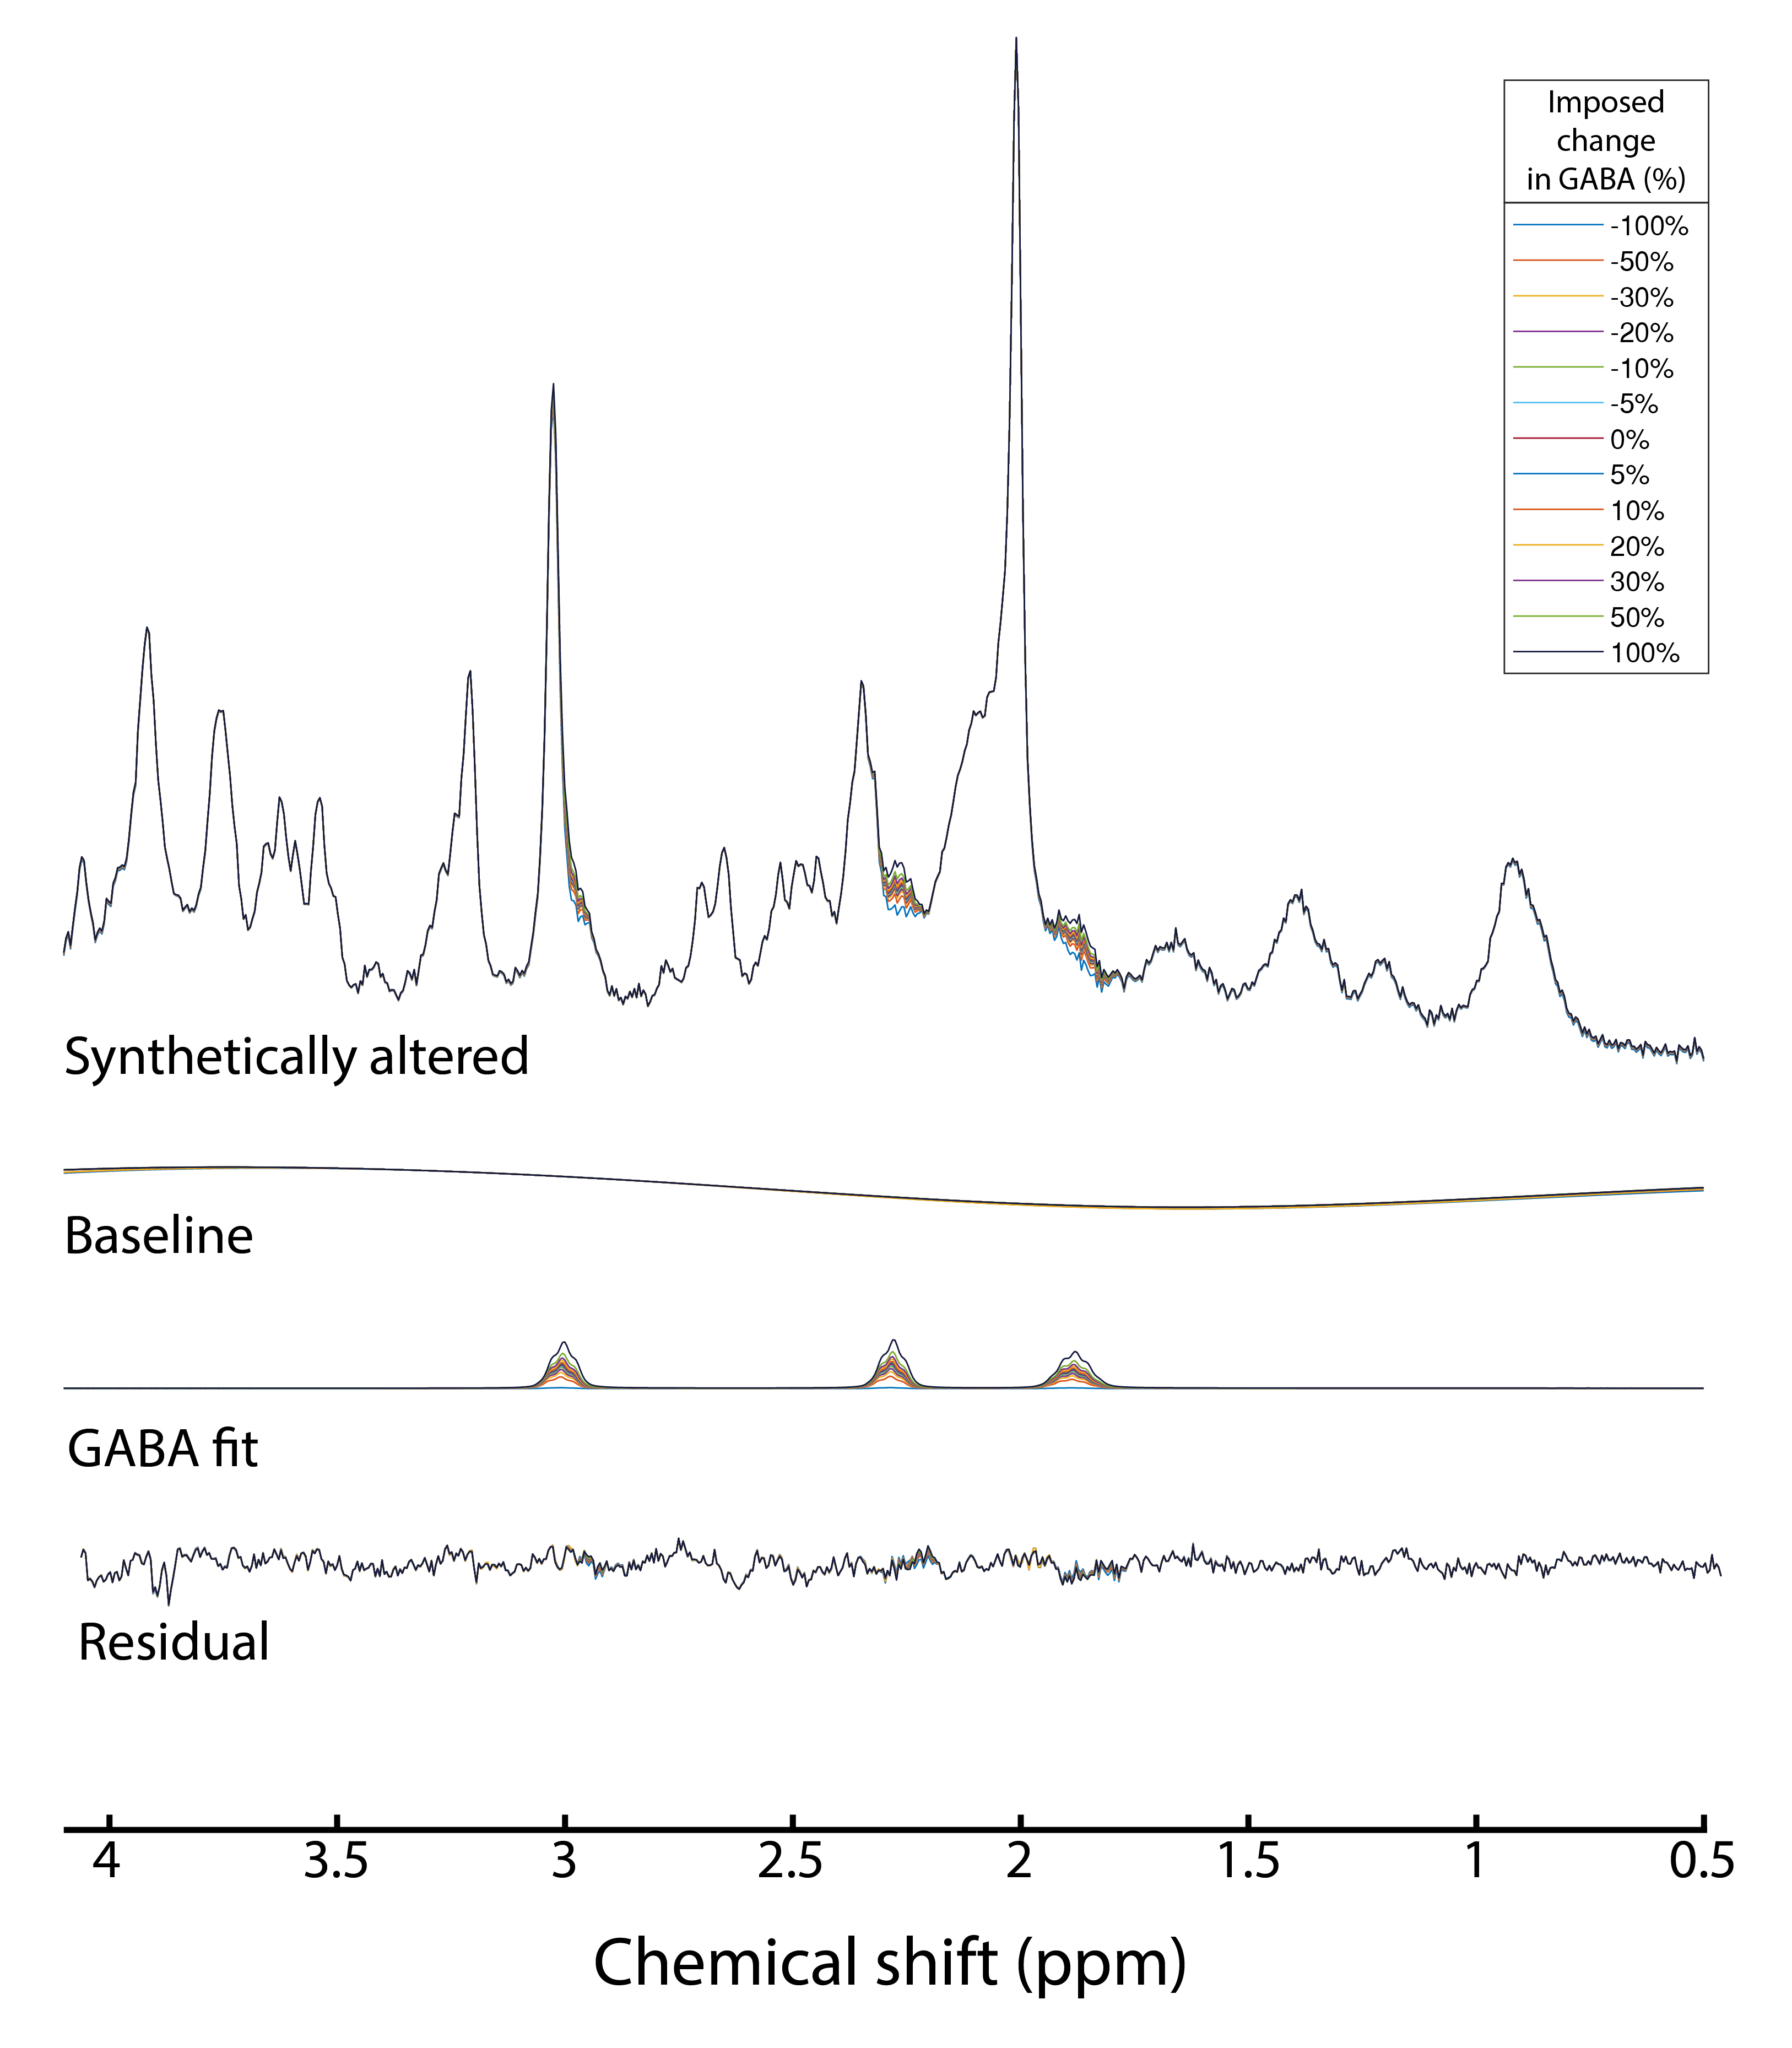
Figure 1. Overview of the synthetically altered spectra and their LCModel outputs for one representative subject. From top to bottom: synthetically altered spectra, fitted baselines, fitted GABA signals and residuals. The overlap of GABA resonances with other metabolite is shown with different colors. The alterations of the spectra caused by changes in GABA concentration are visible at 1.90 and 2.29 ppm whereas almost invisible at 3.00 ppm. The LCModel residuals do not show any structured signals for any of the spectra
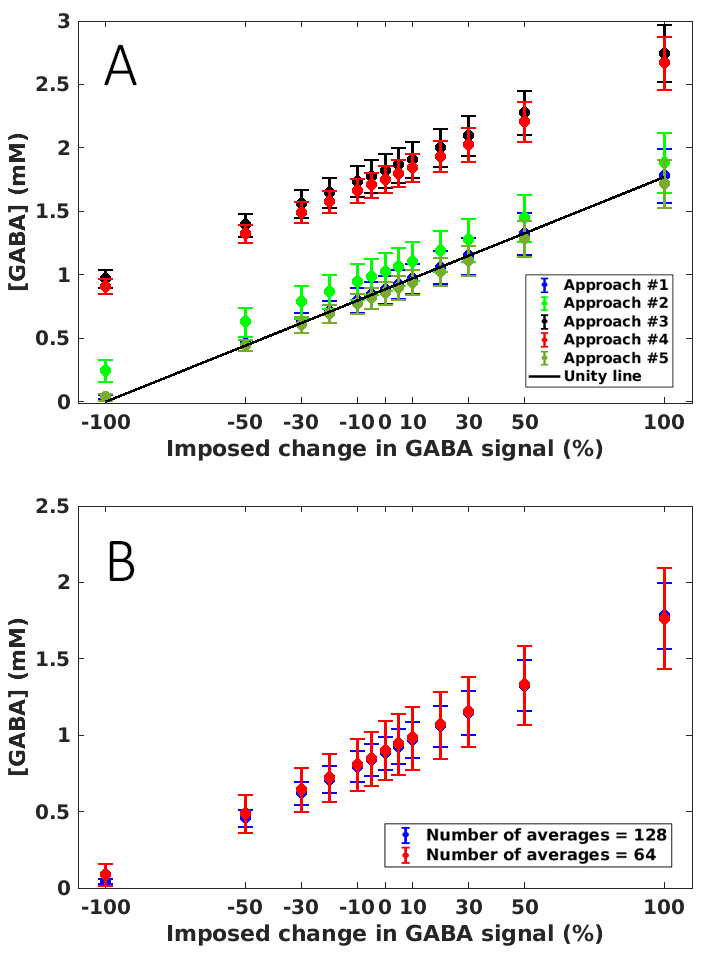
Figure 3. [GABA] values corresponding to the synthetically altered spectra (A) for different LCModel approaches and (B) for different number of averages are plotted as a function of the imposed change in GABA signal. The unity line between imposed change and measured concentration is also plotted. The results showed that the approach #1 (measured MM, stiff baseline and no concentration ratio priors) allows to correctly quantify the imposed change in GABA concentration. Reducing number of averages does not influence the mean value of [GABA] in a cohort but increase SD.