Hideto Kuribayashi1, Yuta Urushibata1, Thuy Ha Duy Dinh2, Hirohiko Imai3, Sinyeob Ahn4, Ravi Teja Seethamraju5, Tadashi Isa2, and Tomohisa Okada2
1Siemens Healthcare K.K., Tokyo, Japan, 2Human Brain Research Center, Kyoto University Graduate School of Medicine, Kyoto, Japan, 3Kyoto University Graduate School of Informatics, Kyoto, Japan, 4Siemens Medical Solutions, Berkeley, CA, United States, 5Siemens Medical Solutions, Boston, MA, United States
1Siemens Healthcare K.K., Tokyo, Japan, 2Human Brain Research Center, Kyoto University Graduate School of Medicine, Kyoto, Japan, 3Kyoto University Graduate School of Informatics, Kyoto, Japan, 4Siemens Medical Solutions, Berkeley, CA, United States, 5Siemens Medical Solutions, Boston, MA, United States
H1-α-glucose
peak at posterior cingulate cortex (27-mL volume) was detected with higher SNR
(9.1 vs 5.1) using semi-LASER sequence (32-ms TE) than short-TE STEAM sequence
(5-ms TE) at 7T in shorter scan time (11 vs 12.5 minutes), respectively.
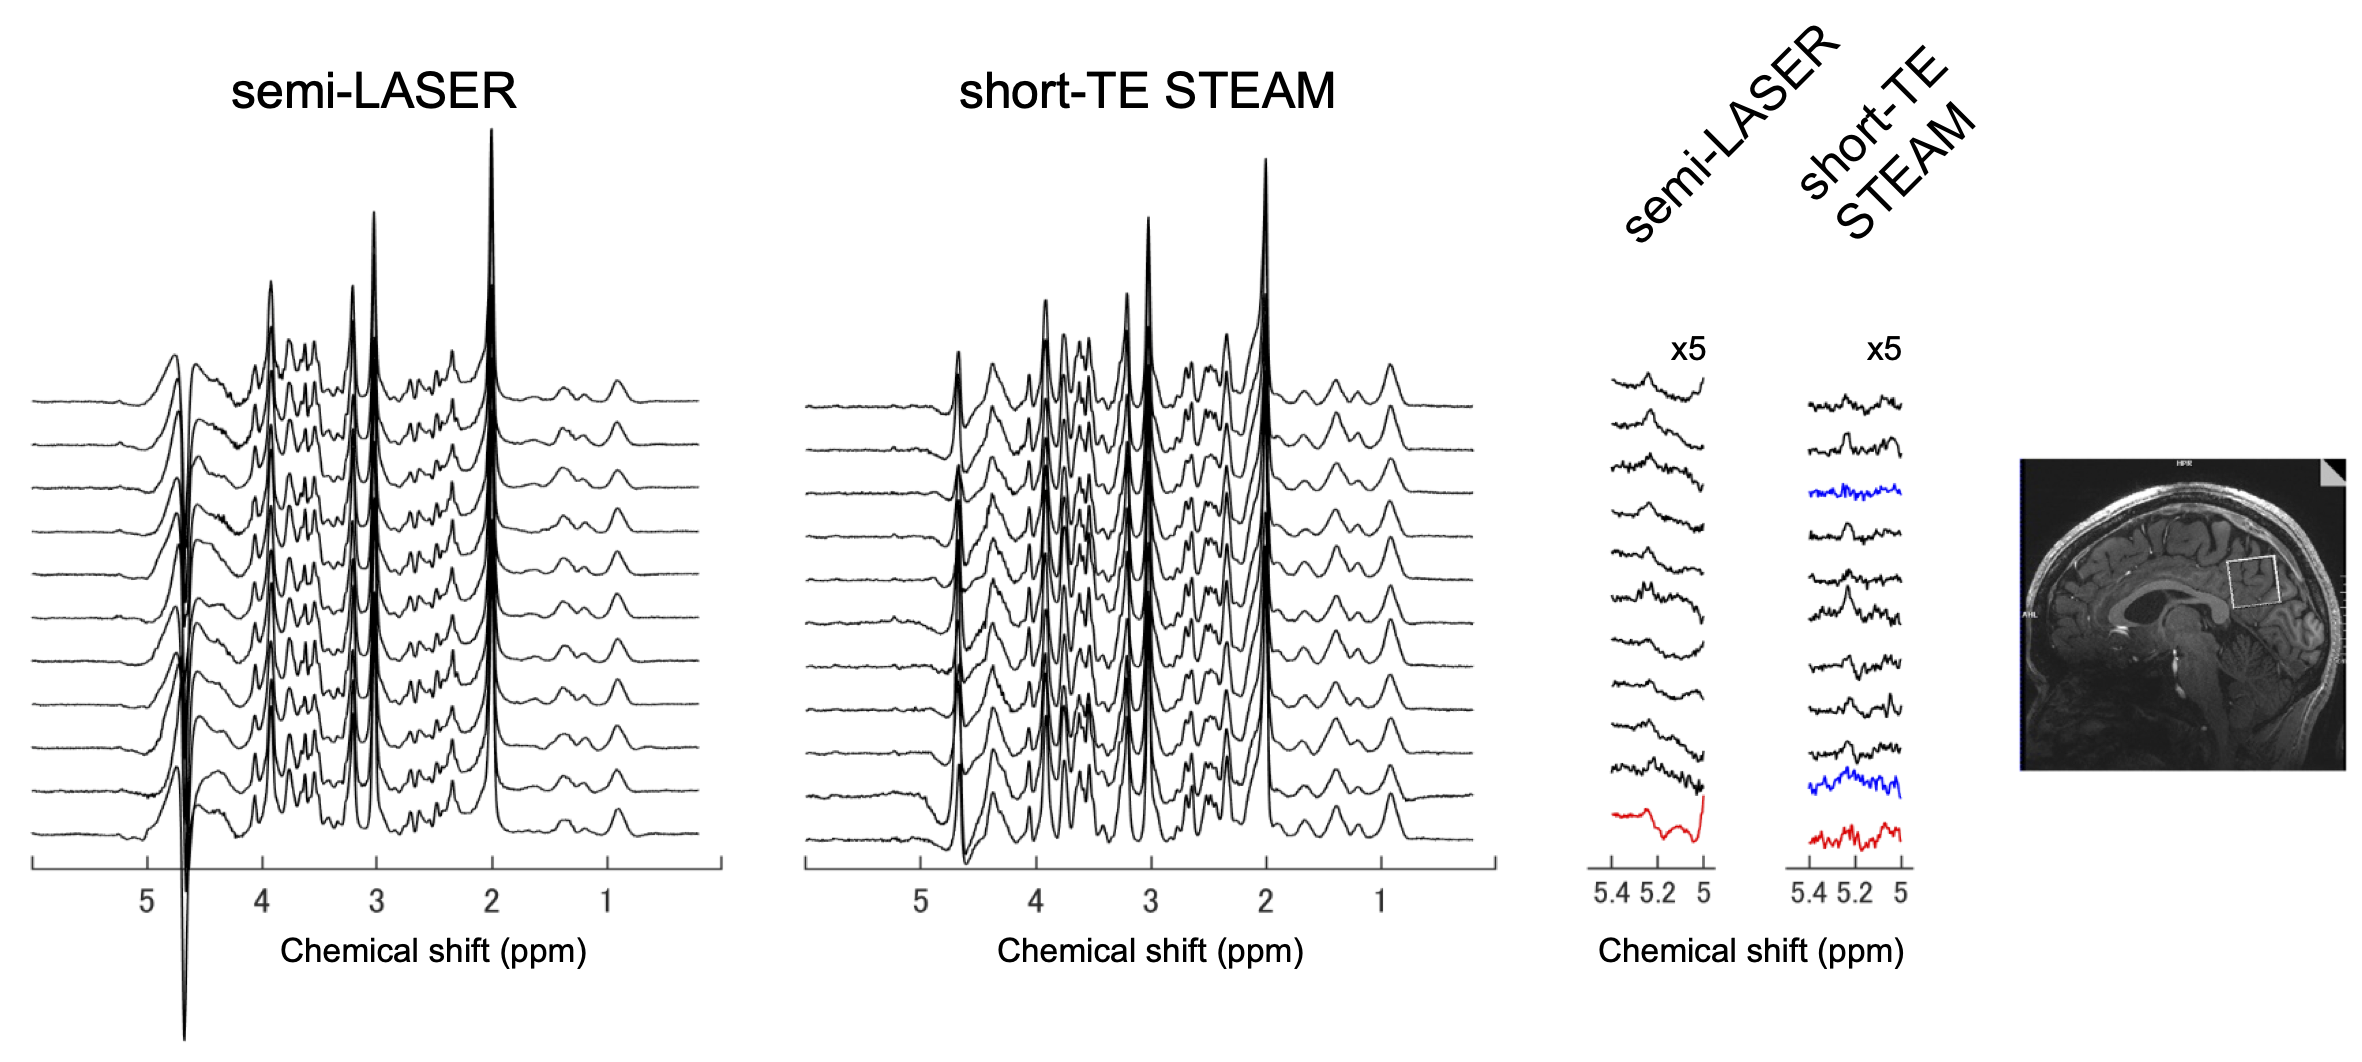
FIGURE 1. MR spectra acquired from all
subjects and voxel position (3.0×3.0×3.0 (cm)3 on 3D MPRAGE T1-weighted
images (TR/TI = 2300/1050 ms)). The
spectra baseline-corrected on LCModel are stacked with SNR of the H1-α-glucose peak at 5.23 ppm in semi-LASER spectra from low (bottom) to
high (top). The downfield spectra
(5.0-5.4 ppm in the right panel) are scaled with 5-fold. In blue short-TE STEAM spectra, the glucose
peak was not identified. In red spectra
acquired from a subject, the glucose peak could not be fitted due to strong
nuisance signals between the peaks of glucose and water.
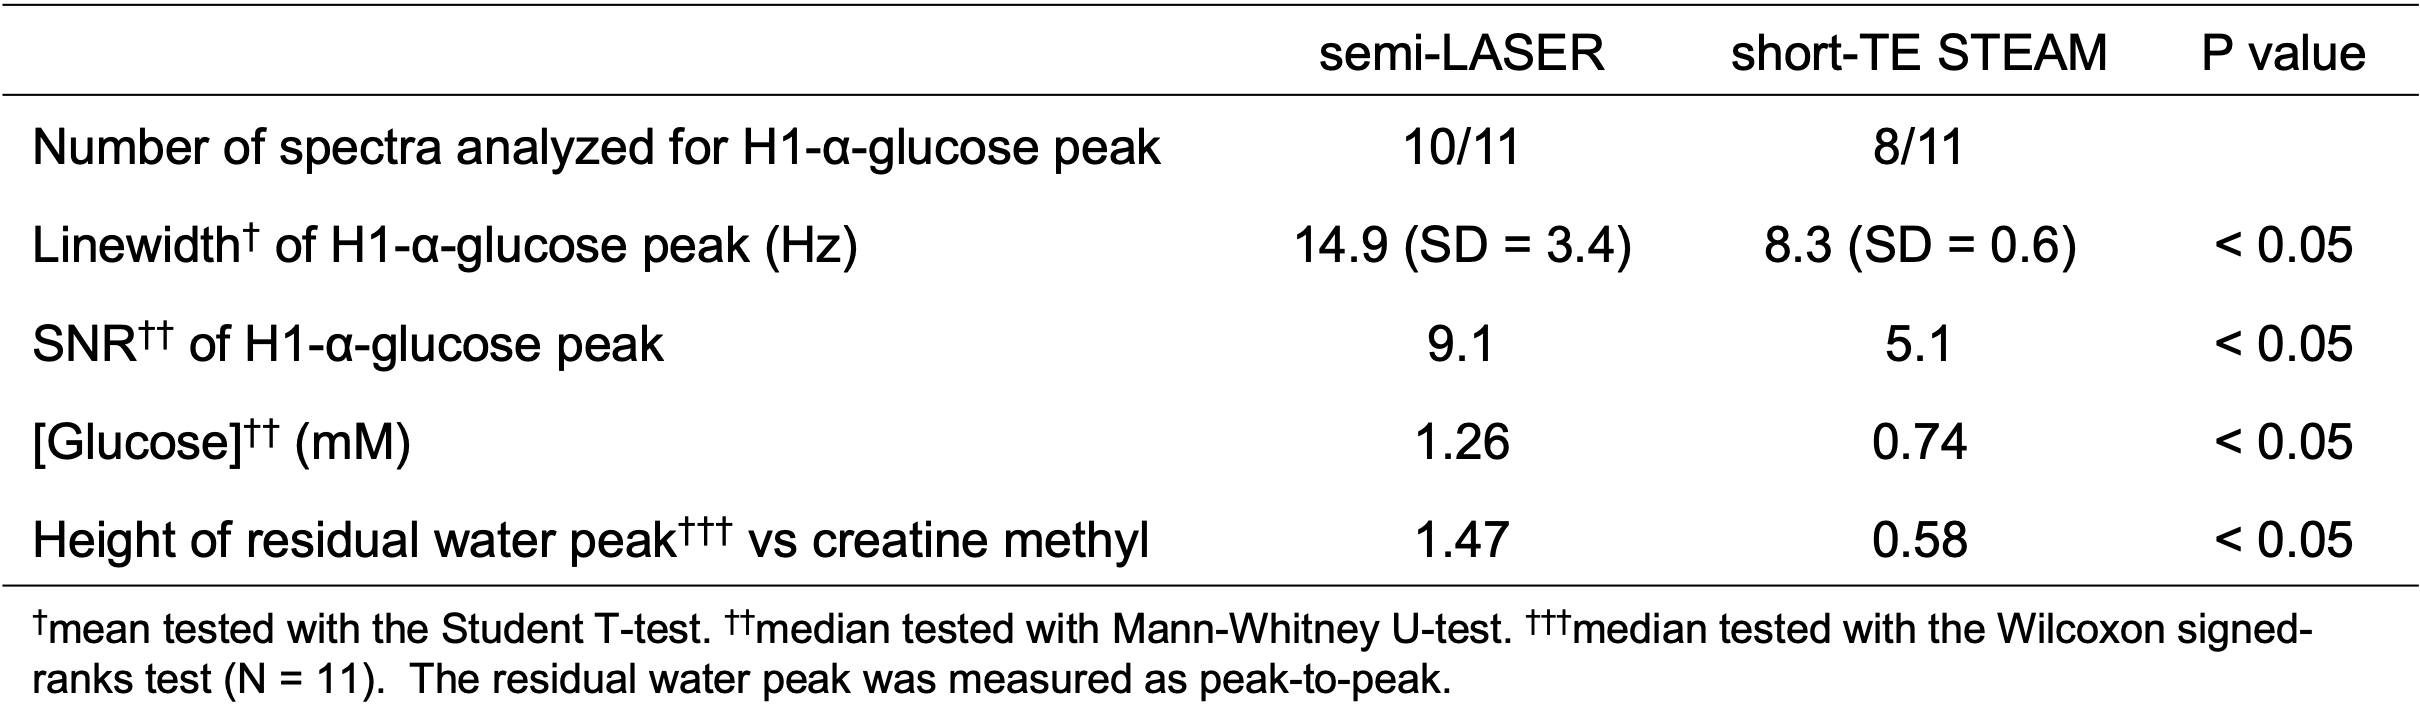
TABLE 1. Results
from the spectral analysis.