Alexandra Lipka1,2, Wolfgang Bogner1,2, Assunta Dal-Bianco3, Gilbert Hangel1, Bernhard Strasser1, Stanislav Motyka1, Lukas Hingerl1, Paulus Rommer3, Fritz Leutmezer3, Stephan Gruber1, Siegfried Trattnig1,2, and Eva Heckova1
1High Field MR Centre, Department of Biomedical Imaging and Image-guided Therapy, Medical University of Vienna, Vienna, Austria, 2Christian Doppler Laboratory for Clinical Molecular MR Imaging, Vienna, Austria, 3Department of Neurology, Medical University of Vienna, Vienna, Austria
1High Field MR Centre, Department of Biomedical Imaging and Image-guided Therapy, Medical University of Vienna, Vienna, Austria, 2Christian Doppler Laboratory for Clinical Molecular MR Imaging, Vienna, Austria, 3Department of Neurology, Medical University of Vienna, Vienna, Austria
Free Induction Decay(FID)-MRSI at 7T shows metabolic changes associated with different types of iron accumulation and a metabolic gradient spanning from within the iron rim lesion to its close proximity
Figure
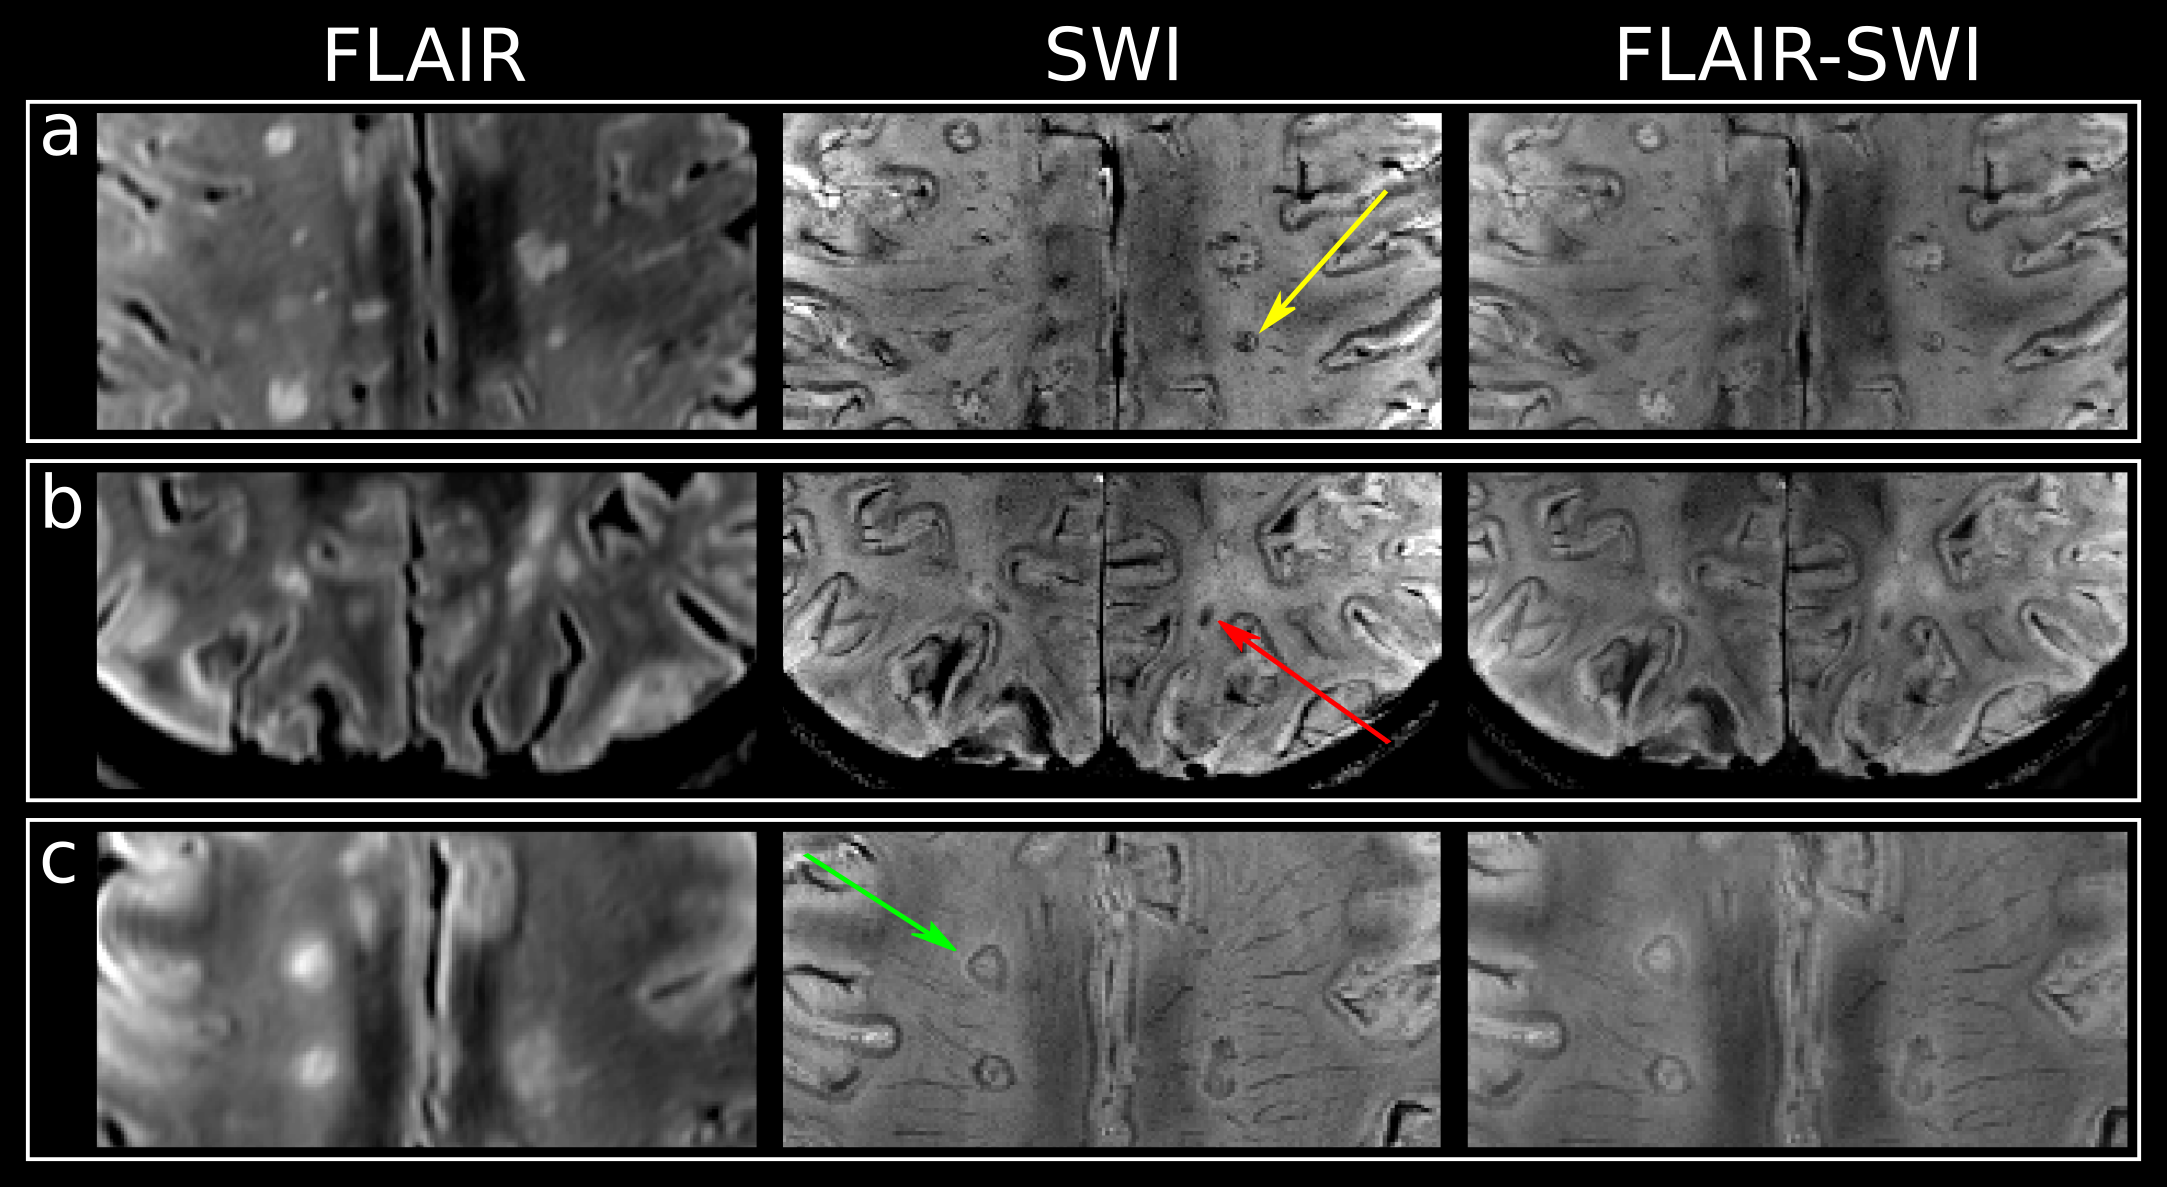
1: T2-FLAIR, SWI and overlaid FLAIR-SWI images of(a) lesions
categorized as “transition” with yellow arrow pointing towards an
example, (b) “area” iron deposition indicated by a red arrow and
(c) “rim” lesion with an abundant iron rim indicated by a green
arrow.
Figure
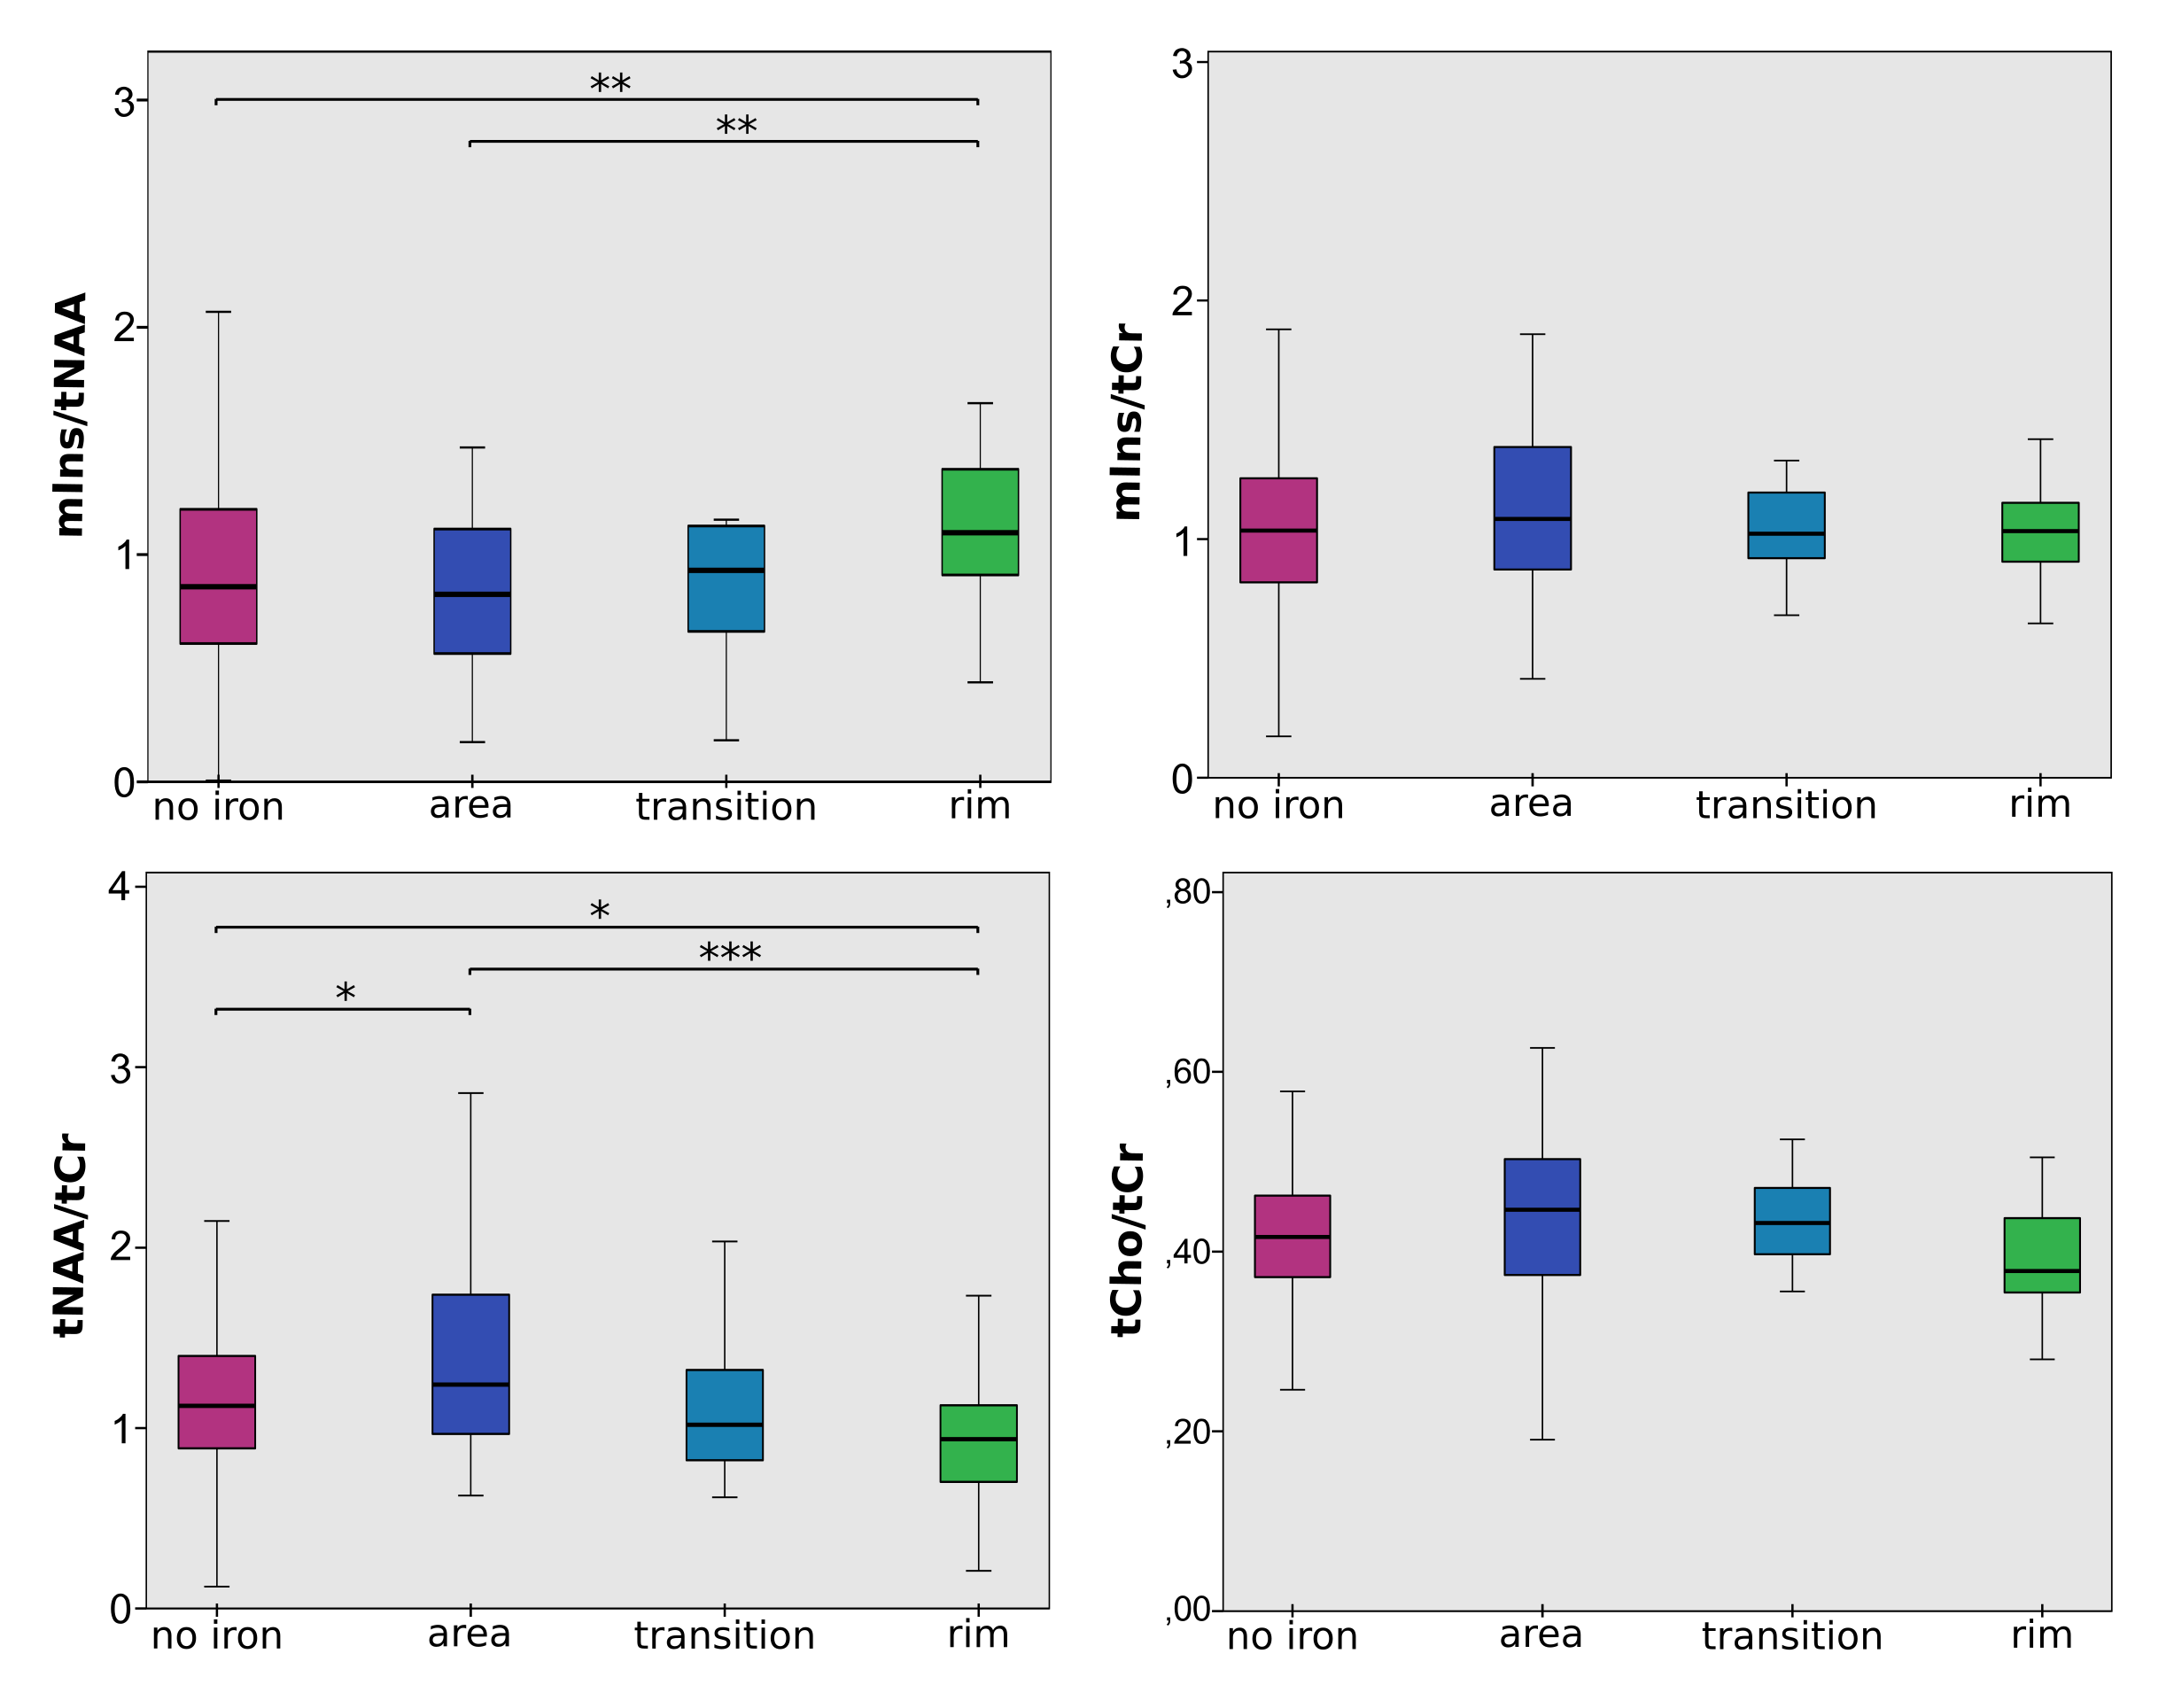
2: Boxplot diagram for mIns/tNAA, mIns/tCr, tNAA/tCr and tCho/tCr and
the different lesion categories “no iron”, “area”,
“transition” and “rim”. Significant results were found
between lesion categories for mIns/tNAA and tNAA/tCr, but mIns/tCr
stays constantly elevated for all “black hole” lesions.