Wufan Zhao1, Eduardo Coello1, Marcia Sahaya Louis1, Katherine Breedlove1, Assaf Tal2, and Alexander Lin1
1Radiology, Brigham and Women's Hospital, Boston, MA, United States, 2Chemical and Biological Physics, Weizmann Institute of Science, Rehovot, Israel
1Radiology, Brigham and Women's Hospital, Boston, MA, United States, 2Chemical and Biological Physics, Weizmann Institute of Science, Rehovot, Israel
This work introduces a novel way to analyze MR spectroscopic imaging scans by characterizing grey matter and white matter tissue types based on their contributions to metabolite concentrations. The method detected and visualized different metabolic profiles between grey and white matter.
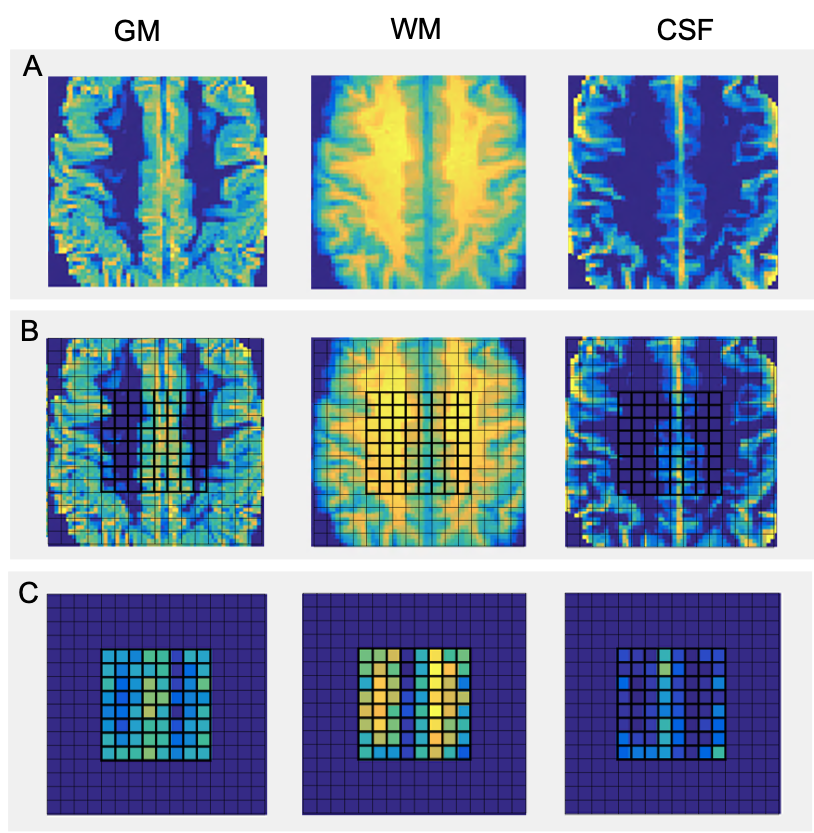
Fig. 1. Maps of GM, WM, and CSF partial volumes of a single subject. (A) High resolution reconstructed images obtained from 60x60 matrices of grey matter, white matter, and cerebrospinal fluid partial volume fractions. (B) Partial volume maps with 16x16 grid overlay composed of 10x10x10 mm voxels. (C) Lower resolution reconstructed images from 8x8 matrices of the three partial fractions. Central 8x8 grids are in bold. A color scale of blue to yellow is used, with blue being lower and yellow being greater partial volume fraction at each voxel. Partial fractions were obtained via VDI.
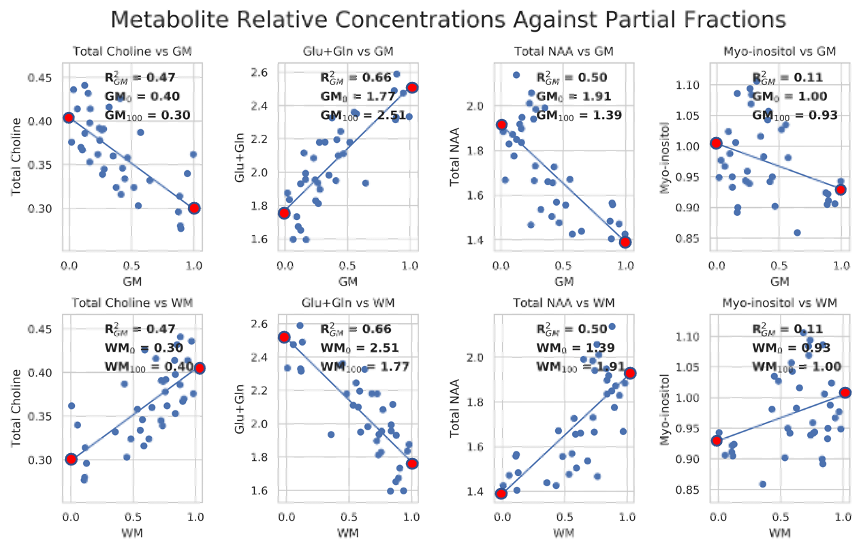
Fig. 2. Scatterplots of metabolite ratios to creatine (y-axis) against partial volume fractions of GM or WM (x-axis). GM is on the top row and WM is on the bottom row. The plots include a linear fit and report R-squared values. The intercepts of the linear fit where partial fractions are equal to 0.0 and 1.0 are shown by red markers (GM0% and GM100% for GM, and WM0% and WM100% for WM). Metabolites include tCho, tNAA, Glx, and mI. High correlations are observed with metabolites that are known to have different concentrations in grey and white matter.