Hailong Li1, Ming Chen1,2, Jinghua Wang3, Nehal A. Parikh4,5, and Lili He1,5
1Imaging Research Center, Department of Radiology, Cincinnati Children's Hospital Medical Center, Cincinnati, OH, United States, 2Department of Electrical Engineering and Computer Science, University of Cincinnati, Cincinnati, OH, United States, 3Deep MRI Imaging Inc., Lewes, DE, United States, 4The Perinatal Institute and Section of Neonatology, Perinatal and Pulmonary Biology, Cincinnati Children's Hospital Medical Center, Cincinnati, OH, United States, 5Department of Pediatrics, University of Cincinnati College of Medicine, Cincinnati, OH, United States
1Imaging Research Center, Department of Radiology, Cincinnati Children's Hospital Medical Center, Cincinnati, OH, United States, 2Department of Electrical Engineering and Computer Science, University of Cincinnati, Cincinnati, OH, United States, 3Deep MRI Imaging Inc., Lewes, DE, United States, 4The Perinatal Institute and Section of Neonatology, Perinatal and Pulmonary Biology, Cincinnati Children's Hospital Medical Center, Cincinnati, OH, United States, 5Department of Pediatrics, University of Cincinnati College of Medicine, Cincinnati, OH, United States
Taking advantage of labeled and unlabeled data,
a semi-supervised graph convolutional network model is able to identify motor impairments
in very preterm infants at 2 years using brain structural connectome obtained
at term-equivalent age with an accuracy of 68.1% and an AUC of 0.67.
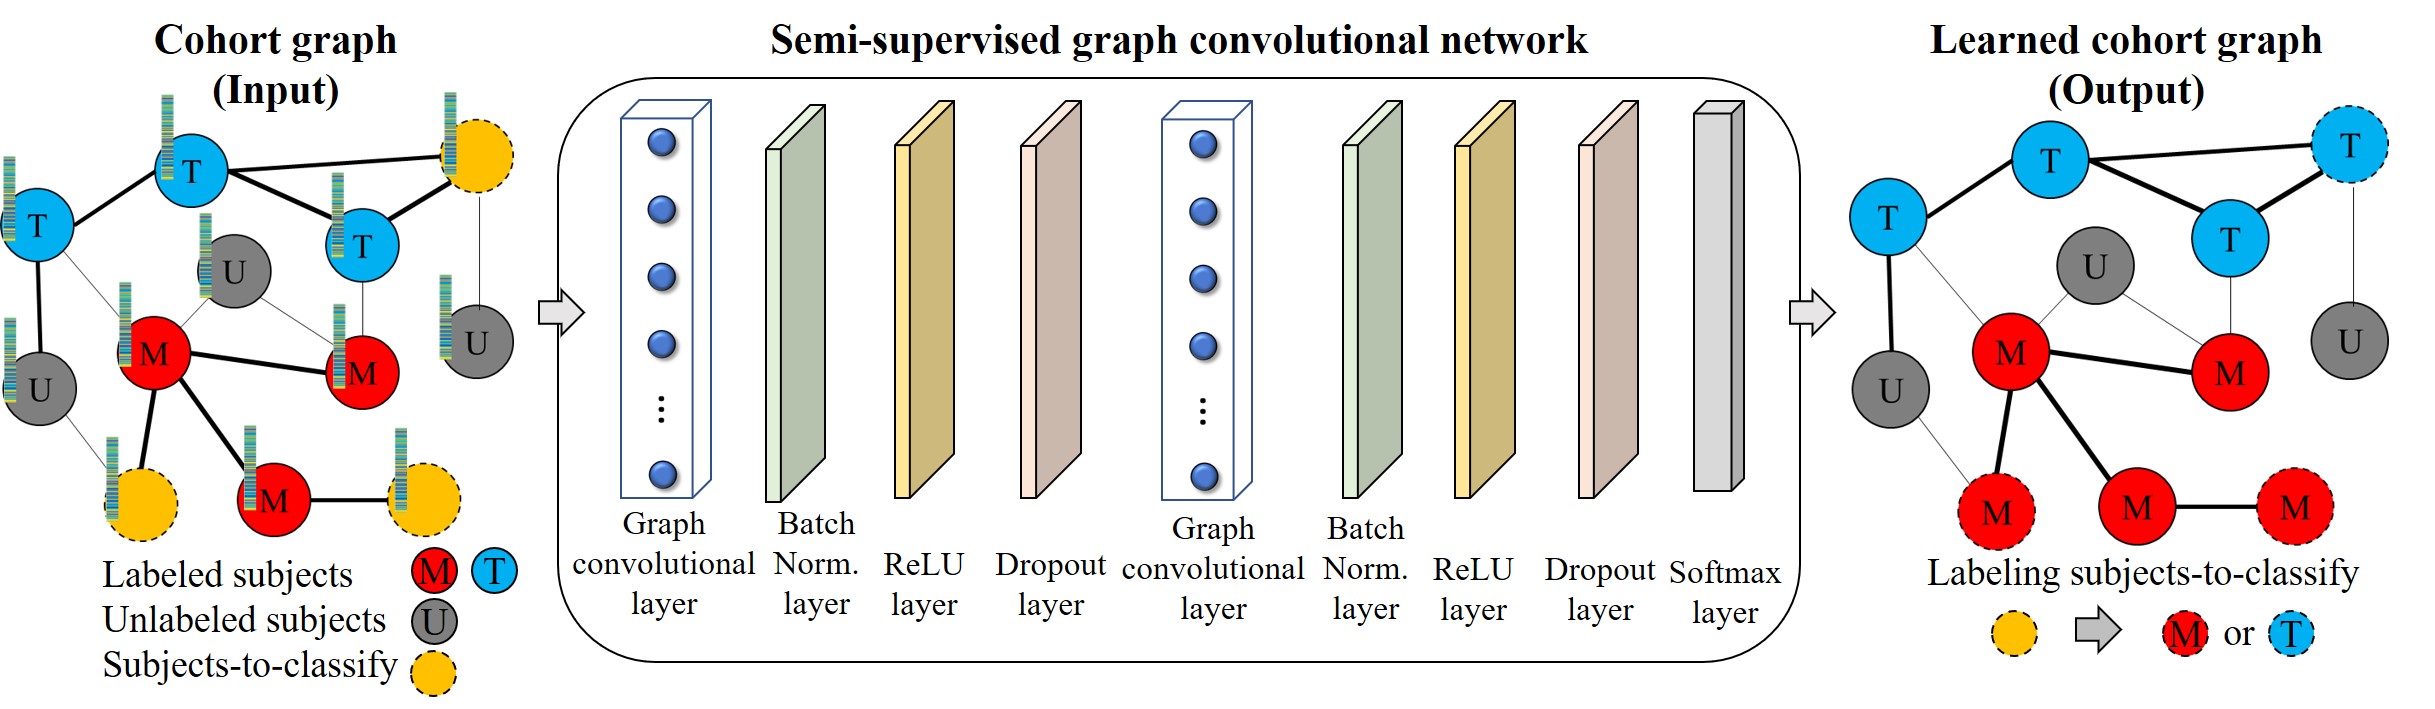
Figure 2. Overview of semi-supervised
graph convolutional network to predict motor impairments in very preterm
infants. The input is a cohort graph that describes the inter-subject
similarities among training (both labeled and unlabeled) and testing (subjects-to-classify)
subjects. The first graph convolutional layer contains 16 graph
convolutional filters. The second graph convolutional layer contains 8 graph convolutional filters. The number of graph convolutional filters were
selected from empirical values [8, 16, 32, 64] based on validation performance.
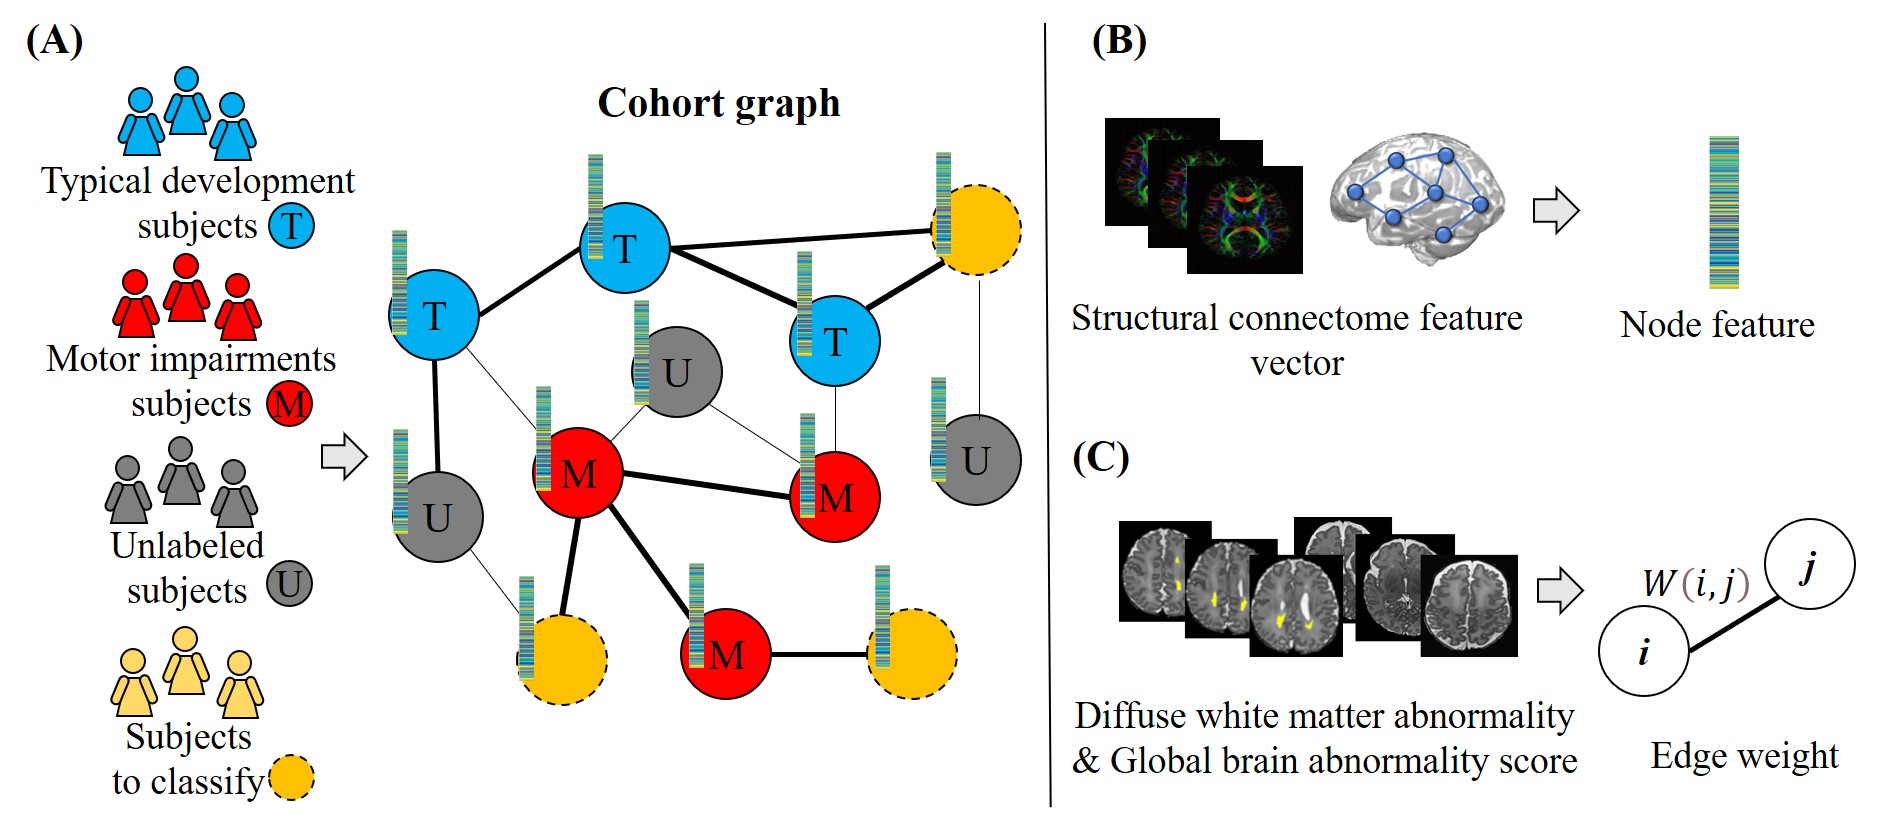
Figure 1. (A) Cohort graph describes
the inter-subject similarities among the training (both labeled and unlabeled)
and testing (subjects to classify) subjects/nodes. (B) Structural
connectome feature vectors are used as the node features in the cohort graph. (C)
Diffuse white matter abnormality volumes and global brain abnormality scores
are used to calculate the inter-subject similarity as edge weights in the
cohort graph.