Katie M Strobel1, Sevgi Gokce Kafali2, Shu-Fu Shih2, Rinat Masamed2, Kara Calkins1, and Holden Wu2
1Pediatrics, University of California Los Angeles, Los Angeles, CA, United States, 2Radiological Sciences, University of California Los Angeles, Los Angeles, CA, United States
1Pediatrics, University of California Los Angeles, Los Angeles, CA, United States, 2Radiological Sciences, University of California Los Angeles, Los Angeles, CA, United States
This study measured fetal and maternal body composition in the third trimester by calculating volume and proton density fat fraction (PDFF). Fetal liver PDFF was associated with maternal pre-pregnancy BMI and maternal SAT PDFF. Pregnancies with gestational diabetes had higher liver PDFF.
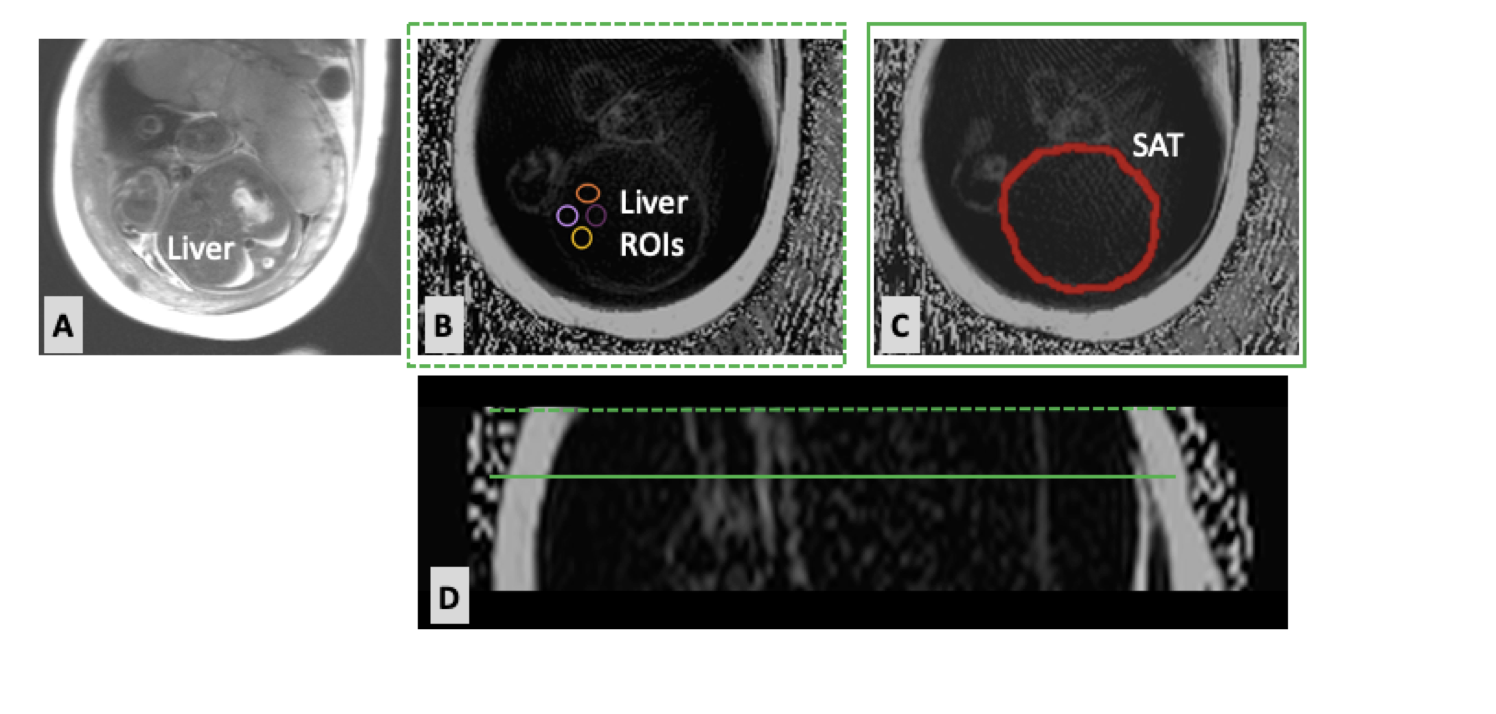
Figure 1. A. T2-HASTE axial images of the fetal liver in a mother with fetal growth restriction to provide an anatomical reference. B. Axial 3-D stack-of-radial FB-MRI PDFF map (range: 0-100%) of the fetal liver. Circular ROIs with 1-cm2 area were used to measure the fetal liver PDFF. C. Axial 3-D stack-of-radial FB-MRI PDFF maps of the fetal abdomen. The red ROI was used to measure fetal abdominal subcutaneous adipose tissue (SAT) volume and PDFF. D. Coronal reformatted PDFF map of fetus. The green dashed and solid lines indicate the axial slices in panels B and C, respectively.
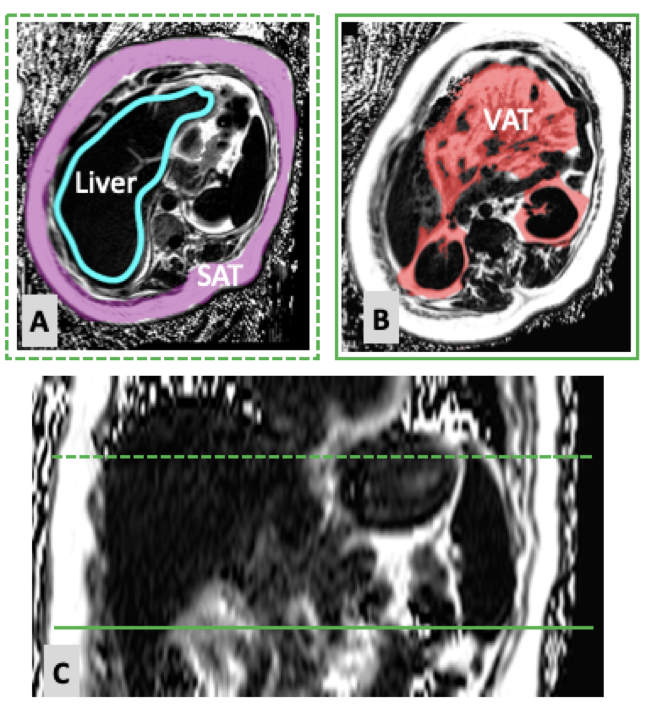
Figure 2. A. Axial 3-D stack-of-radial FB-MRI PDFF maps (range: 0-100%) of the maternal liver in a mother with gestational diabetes. Cyan outline measured liver PDFF. Purple ROI measured subcutaneous adipose tissue (SAT) PDFF and volume. B. Axial 3-D stack-of-radial FB-MRI PDFF maps (range: 0-100%) of the maternal abdomen. Red ROI measured visceral adipose tissue (VAT) PDFF and volume. C. Coronal reformatted PDFF map of the maternal liver and abdomen. The green dashed and solid lines indicate the axial slices in panels A and B, respectively.