Qi Liu1, Wei Xing1, Jilei Zhang2, JingGang Zhang1, Jie Chen1, and Bei Li1
1Department of Radiology, The Third Affiliated Hospital of Soochow University, Changzhou, China, 2Clinical Science, Philips Healthcare, Shanghai, China
1Department of Radiology, The Third Affiliated Hospital of Soochow University, Changzhou, China, 2Clinical Science, Philips Healthcare, Shanghai, China
This study explored the feasibility of evaluating
fibrosis of
patients with pancreatic ductal adenocarcinoma (PDAC) and correlate it with
histopathological features using intravoxel incoherent motion diffusion-weighted
imaging (IVIM-DWI) compared with diffusion-weighted imaging (DWI). This
retrospective study assessed 50 patients with surgically resected, pathologically
confirmed PDAC who underwent DWI and IVIM-DWI. The tumor tissue was stained
with sirius red, CD34, and CK19 to quantitate fibrosis, microvascular density
(MVD), and tumor cell density. Patients were classified into low- and
high-fibrosis groups based on histopathological features. ADC, D, D*, and f
generated from IVIM-DWI were measured in tumor areas by two radiologists
independently. ADC
with b (0, 500), ADC
with b (0, 800), D, D*,
and f values were compared between
high- and low-fibrosis groups using the Student t test. The association between quantitative DWI
parameters and histopathology was assessed using correlation analysis. The D values were lower in the high-fibrosis
group than in the low-fibrosis group while the f values followed the opposite trend. Further, no statistically
significant differences were found in ADC and D* values between the high- and low-fibrosis groups.
A significant negative correlation between D values and fibrosis and a significant
positive correlation between f values
and fibrosis were observed. D and ƒ values derived from the IVIM model had
high sensitivity and diagnostic performance for grading fibrosis in PDAC
compared with the conventional DWI model. IVIM-DWI could serve as an imaging biomarker for predicting the fibrosis grade of PDAC.
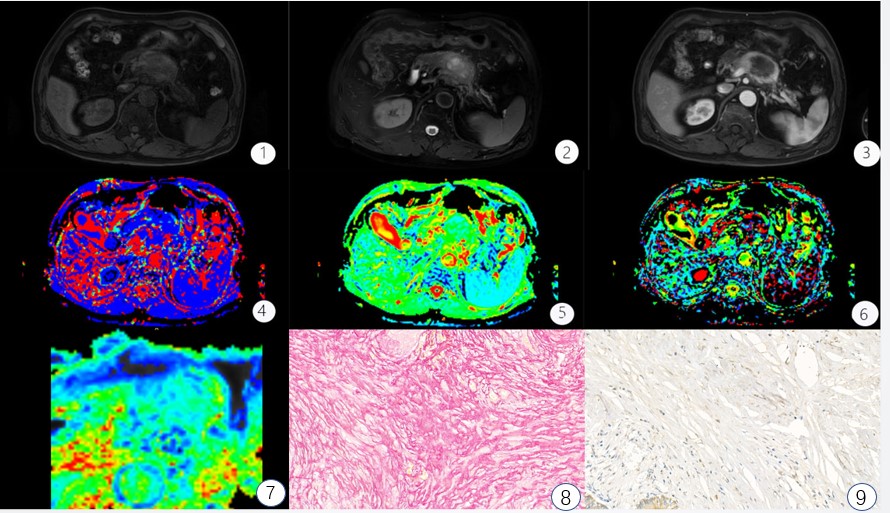
FIGURE 1: A 67-year-old male with high fibrosis
PDAC. ①-③ T1WI, T2WI,
arterial phase images, Pancreatic tumors show low T1WI signal, slightly higher
signal on the T2WI, the arterial phase mild enhancement; ④-⑦ D*, D, f, ADC parameters mappings, 64.5 μm2/ms,
1.16 μm2/ms, 18.03%, 1.2 μm2/ms, respectively. ⑧-⑨
pathological images of Sirius red and CD34 staining, Fibrosis level is 47%, and
MVD is 5.6%.
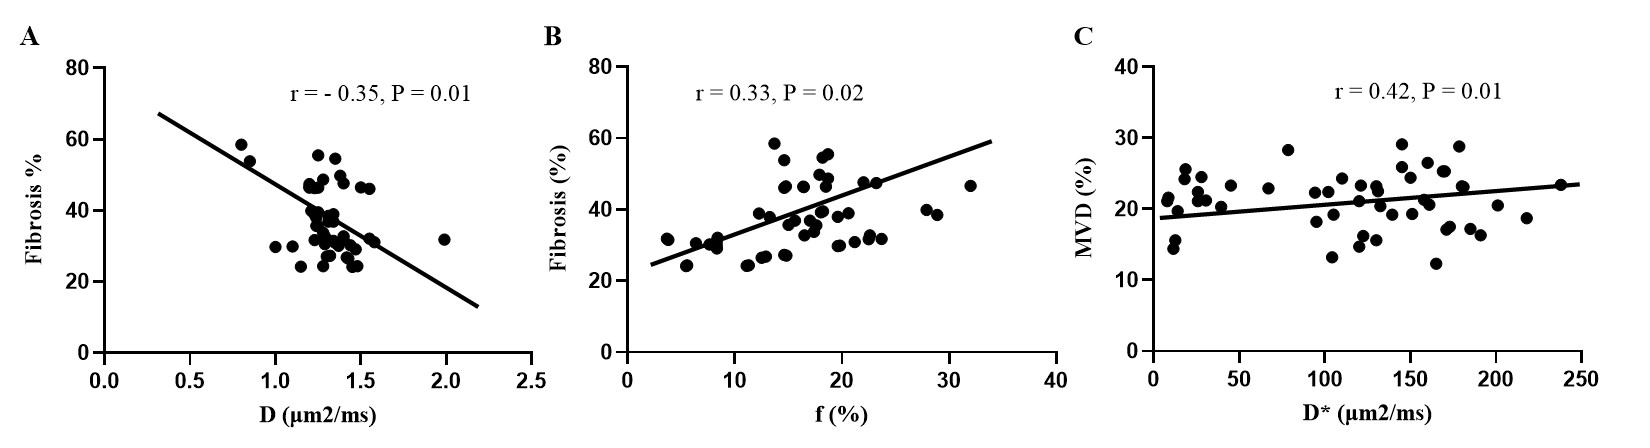
Figure 5. Correlation Between DWI Parameters and Histopathology Features. (A) The
correlation between D values and fibrosis. (B) The correlation between f values
and fibrosis. (C) The correlation between D* and MVD.