Yunxing Tang1, Ailian Liu1, Jiazheng Wang2, Zhiwei Shen2, Yunsong Liu1, Yuhui Liu1, Anliang Chen1, and QingWei Song1
1The First Affiliated Hospital of Dalian Medical University, Dalian, China, 2Philips Healthcare, Beijing, China
1The First Affiliated Hospital of Dalian Medical University, Dalian, China, 2Philips Healthcare, Beijing, China
T2 values were significantly
higher in rectal cancer than those in the healthy rectal wall, and significantly
increased after chemotherapy. Quantitative T2 mapping might be a promising non-invasive method in the diagnosis
and chemotherapy response tracking of rectal cancer.
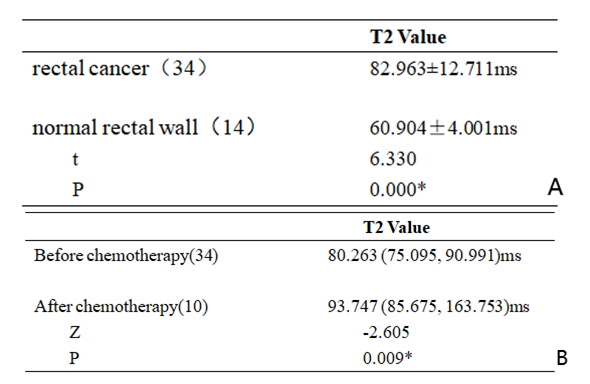
Table 3. Comparison of T2 values in rectal cancer and healthy rectal wall(A);
Comparison of T2 values in rectal
cancer before and after chemotherapy(B)
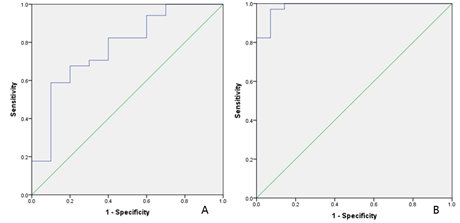
Figure
2. The AUC of T2 mapping values to
distinguish rectal cancer before and after chemotherapy was 0.774 with sensitivity
of 0.588 and specificity of 0.900 and the feasible threshold was 81.738 (A). The
AUC of T2 mapping values to distinguish normal rectal wall and
rectal cancer was 1 with sensitivity of 0.971 and specificity
of 0.929 and the feasible threshold was 66.183 (B).