Ghoncheh Amouzandeh1, Kevin A Heist1, Dariya I Malyarenko1, Youngsoon Jang1, Tanner Robison1, Christopher Bonham1, Cyrus Amirfazli1, Scott D Swanson1, Gary D Luker1, Brian D Ross1, and Thomas L Chenevert1
1Radiology, University of Michigan, Ann arbor, MI, United States
1Radiology, University of Michigan, Ann arbor, MI, United States
We showed the application and repeatability of quantitative MRI metrics such as proton density fat fraction, magnetization transfer and apparent diffusion coefficient for mouse bone marrow with myelofibrosis, a blood cancer in which fibrous tissue destroys the normal bone marrow structure.
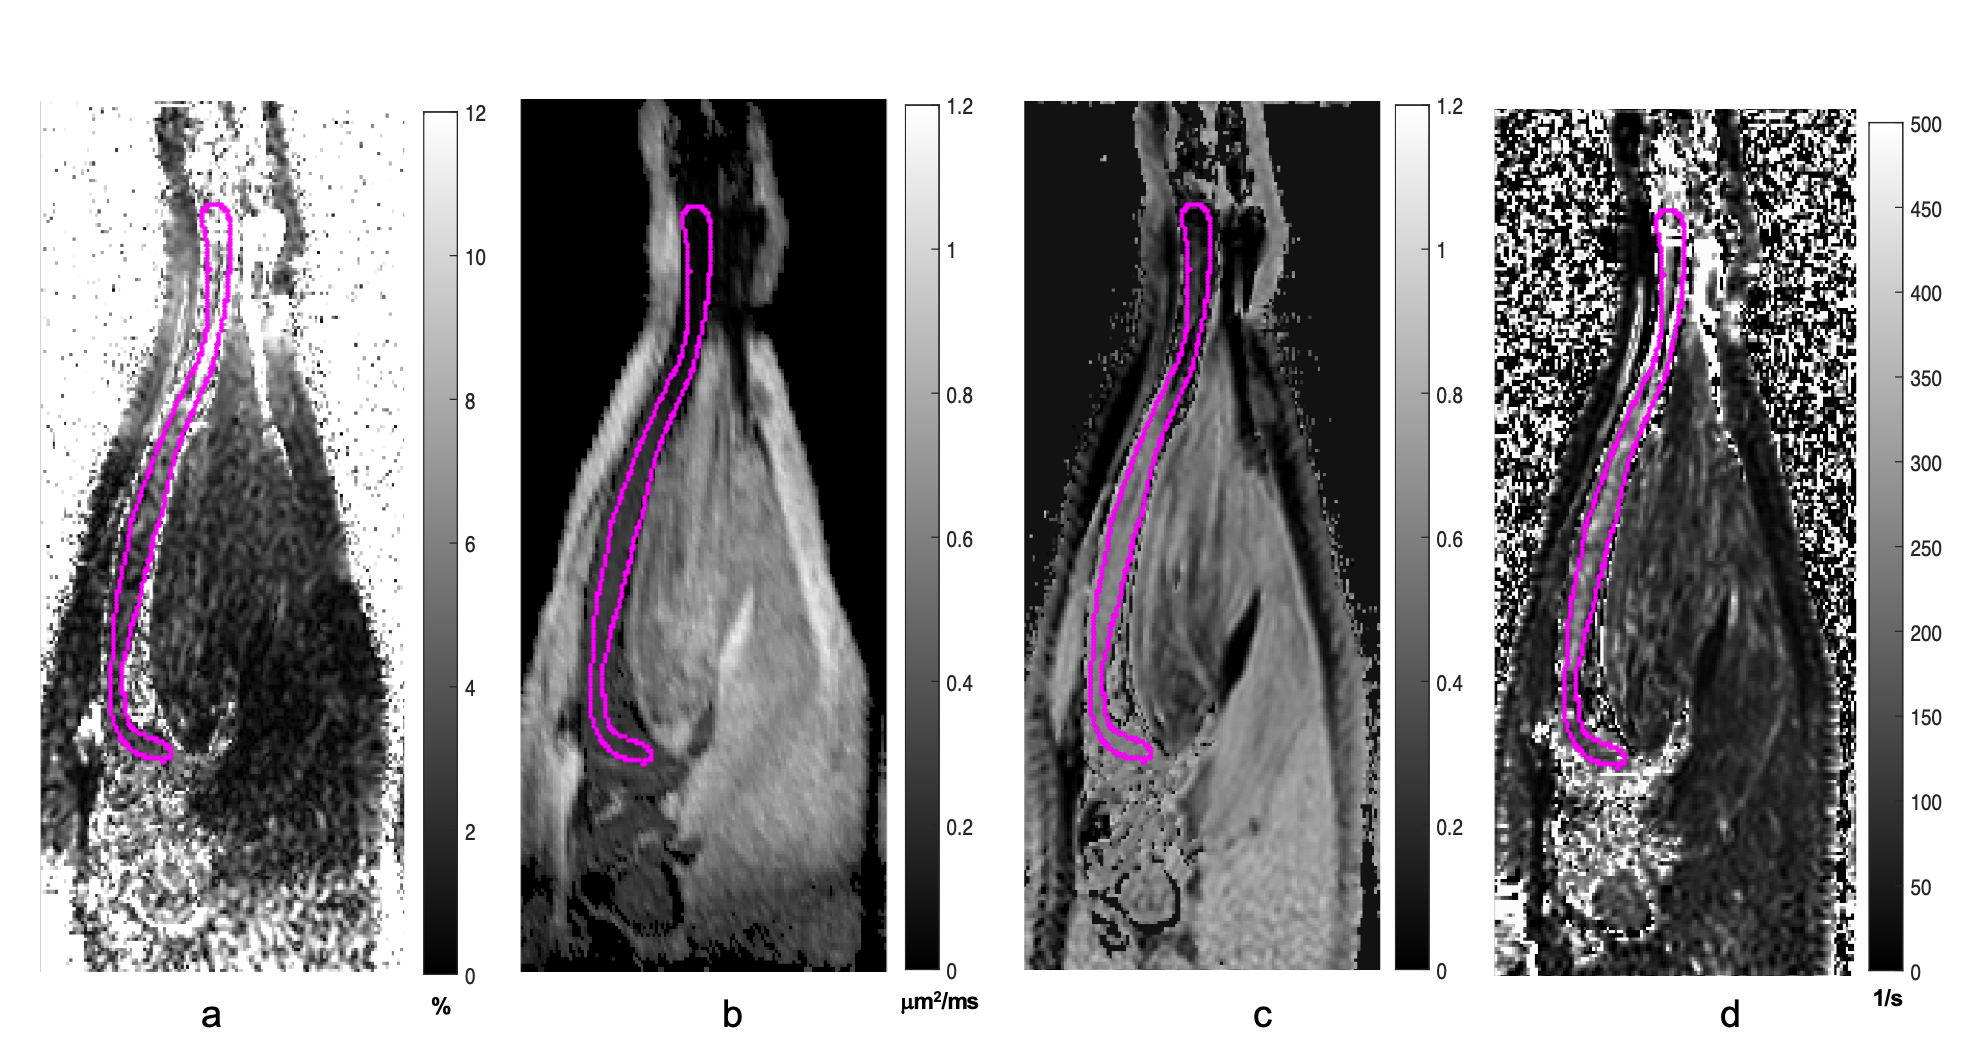
Figure 2: Coronal view of mouse tibia displaying the VOI drawn to segment the bone marrow at the baseline. a) PDFF map, b) ADC map, c) MTR map, and d) R2* map.
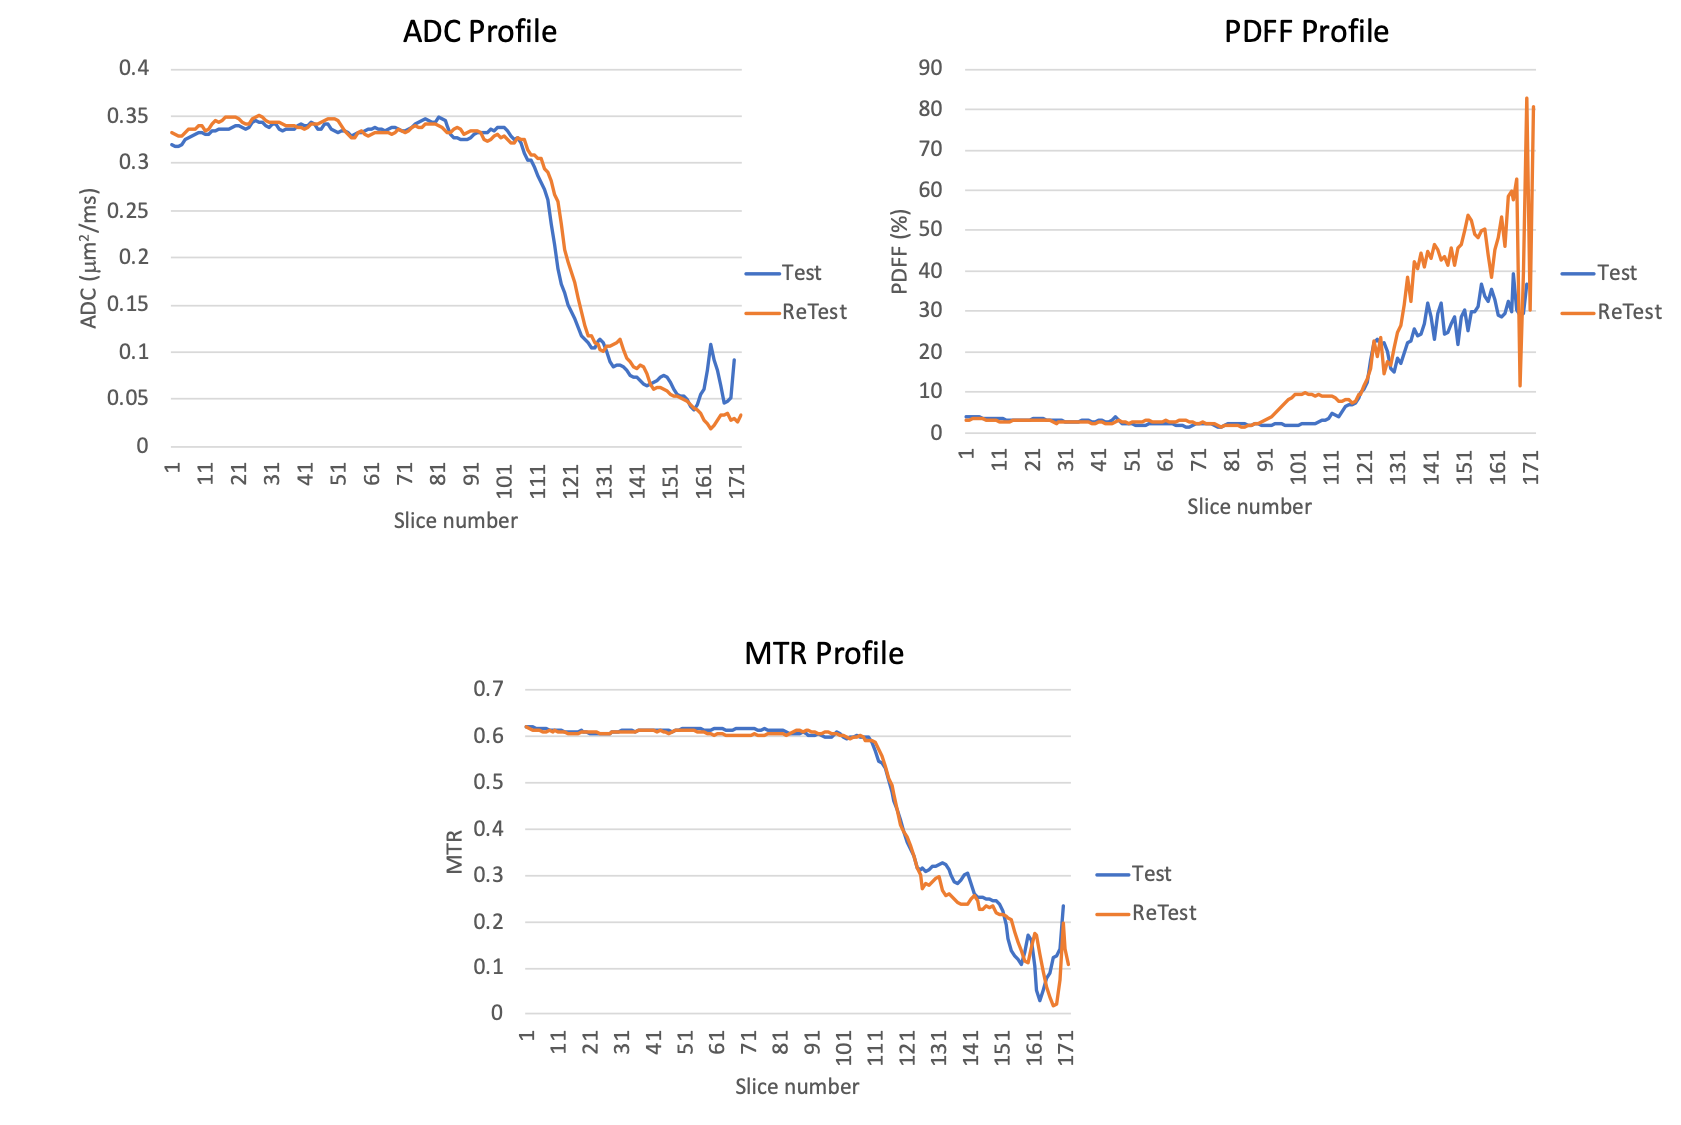
Figure 4: Slice by slice profile of quantitative MRI metrics along the tibia VOI for a test and retest time point.