Kayley Marchena-Romero1,2, Xiang Ji2, Andrew Centen2, Joel Ramirez2, Andrew Lim2, Sandra E Black2, and Bradley J MacIntosh1,2
1Medical Biophysics, University of Toronto, Toronto, ON, Canada, 2Physical Sciences, Sunnybrook Research Institute, Toronto, ON, Canada
1Medical Biophysics, University of Toronto, Toronto, ON, Canada, 2Physical Sciences, Sunnybrook Research Institute, Toronto, ON, Canada
Our results indicate that the rate of vasoconstriction preceding administration of a vasoactive stimulus predicts the magnitude of vasodilation, thus providing additional information about cerebrovascular physiology during a hypercapnia challenge.
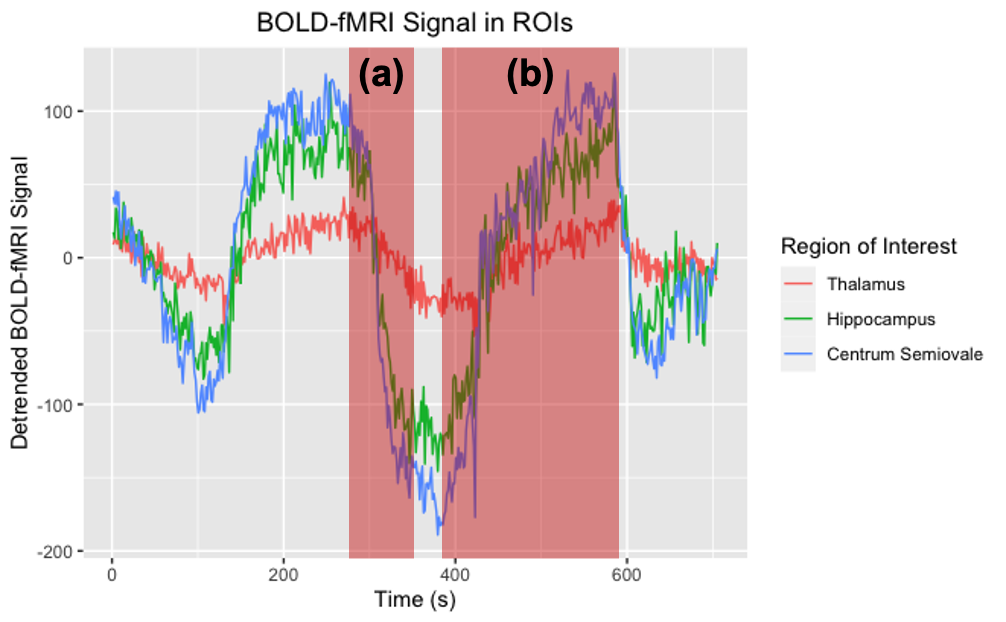
Figure 1. Average time course of mean BOLD signal in thalamus (blue), hippocampus (green), and the centrum semiovale (red), throughout a 12-minute scan at 1550 ms temporal resolution with two CO2 challenges. Shaded areas represent the vasoconstriction (a; first challenge) and vasodilation (b; second challenge) segments to the BOLD-CVR analysis.
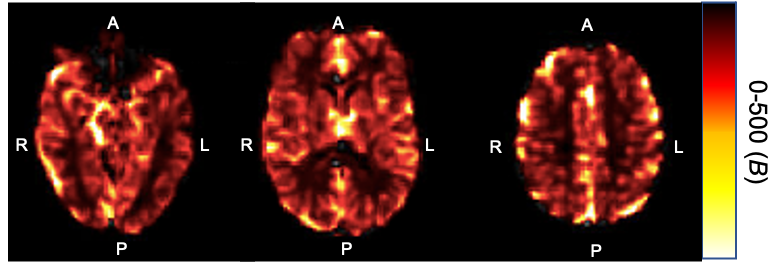
Figure 2. Axial slices of a parametric voxel-wise CVR map from representative participant (female, 65 year old), created using FSL FEAT (FSL, version 5.0, http://fsl.fmrib.ox.ac.uk) for visual inspection of global BOLD signal change. The colour bar denotes the range of parameter estimates obtained for each voxel.