Tiago Martins1, Tales Santini1, Minjie Wu1, Kristine Wilckens1, Davneet Minhas1, James W. Ibinson1, Howard J. Aizenstein1, and Tamer S. Ibrahim1
1University of Pittsburgh, Pittsburgh, PA, United States
1University of Pittsburgh, Pittsburgh, PA, United States
We presented the findings from signal acquisitions of 5 different
human subjects that resulted in identification of frequency bands in the
signal that could potentially match physiological activities.
Figure 1: Fast EPI acquisition (TR=100ms) showing signal changes due to CSF
flow; axial slices with resolution of 1.53 x 1.53 x 3mm and sagittal
slice with resolution of 1.5 x 1.5 x 4.36mm; a) bottom axial slice; b)
top axial slice; c) sagittal slice.
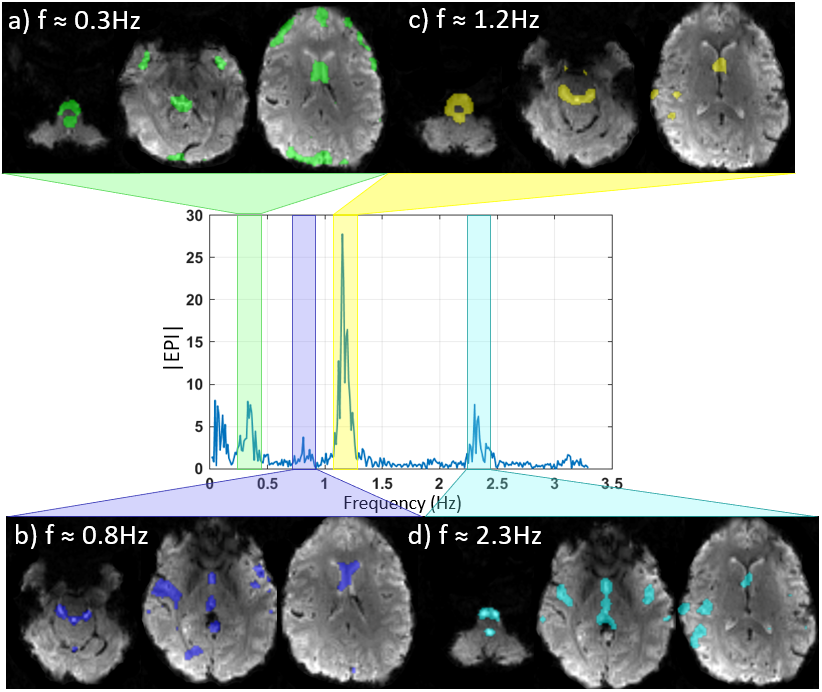
Figure 4: Frequency spectrum with spatial localization of the signal from 4
different frequency bands. For each band, the example show a spatial
coverage of the signal ranging from the bottom of the brain/lower
cerebellum on the left to the center of the brain on the right. The
bandwidth for each band is 0.24Hz. The center frequency is approximately
a) 0.3Hz, b) 0.8Hz, c) 1.2Hz, d) 2.3Hz. The acquisition was done using
an EPI sequence with TR=152ms with 15 slabs of 3 slices each for a total
of 45 slices.