Feng Han1, Gregory L Brown2,3, Yalin Zhu1, Aaron Belkin-Rosen1, Mechelle M Lewis3,4, Guangwei Du3, Yameng Gu1, Paul J Eslinger3,5, Richard B Mailman3,4, Xuemei Huang3,4,5,6,7,8, and Xiao Liu1,8
1Department of Biomedical Engineering, The Pennsylvania State University, State College, PA, United States, 2Department of Engineering Science and Mechanics, The Pennsylvania State University, State College, PA, United States, 3Department of Neurology, Pennsylvania State University Milton S. Hershey Medical Center, Hershey, PA, United States, 4Department of Pharmacology, Pennsylvania State University Milton S. Hershey Medical Center, Hershey, PA, United States, 5Department of Radiology, Pennsylvania State University Milton S. Hershey Medical Center, Hershey, PA, United States, 6Department of Neurosurgery, Pennsylvania State University Milton S. Hershey Medical Center, Hershey, PA, United States, 7Department of Kinesiology, Pennsylvania State University Milton S. Hershey Medical Center, Hershey, PA, United States, 8Institute for Computational and Data Sciences, The Pennsylvania State University, State College, PA, United States
1Department of Biomedical Engineering, The Pennsylvania State University, State College, PA, United States, 2Department of Engineering Science and Mechanics, The Pennsylvania State University, State College, PA, United States, 3Department of Neurology, Pennsylvania State University Milton S. Hershey Medical Center, Hershey, PA, United States, 4Department of Pharmacology, Pennsylvania State University Milton S. Hershey Medical Center, Hershey, PA, United States, 5Department of Radiology, Pennsylvania State University Milton S. Hershey Medical Center, Hershey, PA, United States, 6Department of Neurosurgery, Pennsylvania State University Milton S. Hershey Medical Center, Hershey, PA, United States, 7Department of Kinesiology, Pennsylvania State University Milton S. Hershey Medical Center, Hershey, PA, United States, 8Institute for Computational and Data Sciences, The Pennsylvania State University, State College, PA, United States
This study used the coupling between resting-state global BOLD signal and CSF flow to quantify the glymphatic function and found this coupling metric is significantly reduced in PD patients with cognitive decline.
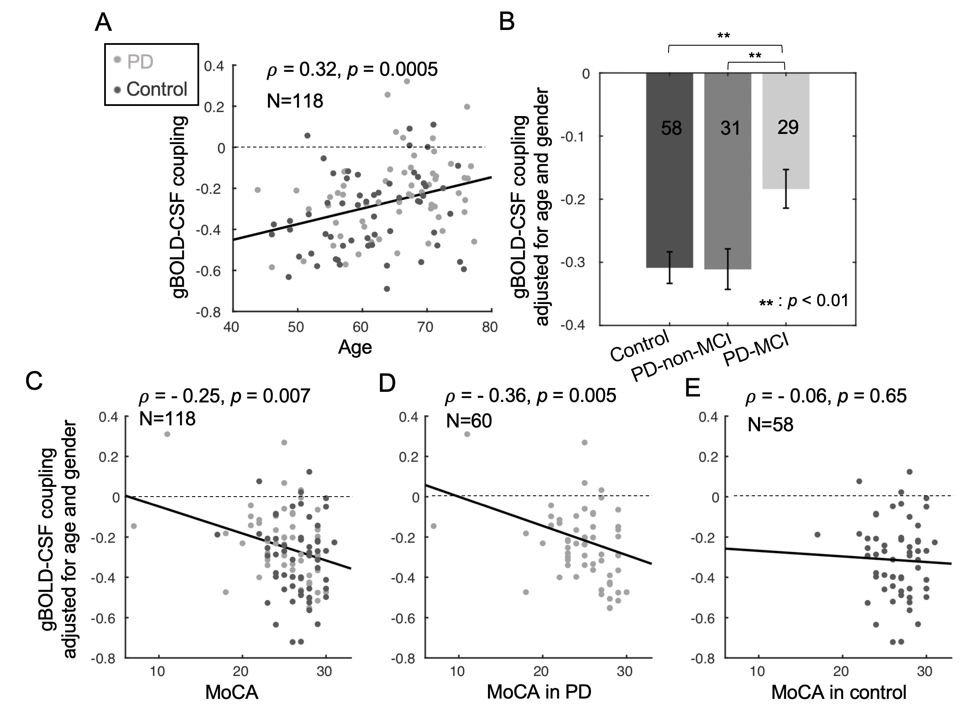
Fig. 2. The associations of gBOLD-CSF coupling to age, disease condition, MoCA, and UPDRS. (A) The strength of the gBOLD-CSF coupling (global BOLD-CSF correlation at +4-sec lag) decreased with age (Spearman’s ρ = 0.32, p = 0.0005). Age- and gender-adjusted gBOLD-CSF coupling is significant weaker in PD-MCI group (B) and significantly correlated with MoCA scores across all the subjects (C), within the PD group (D), but not across controls (E).
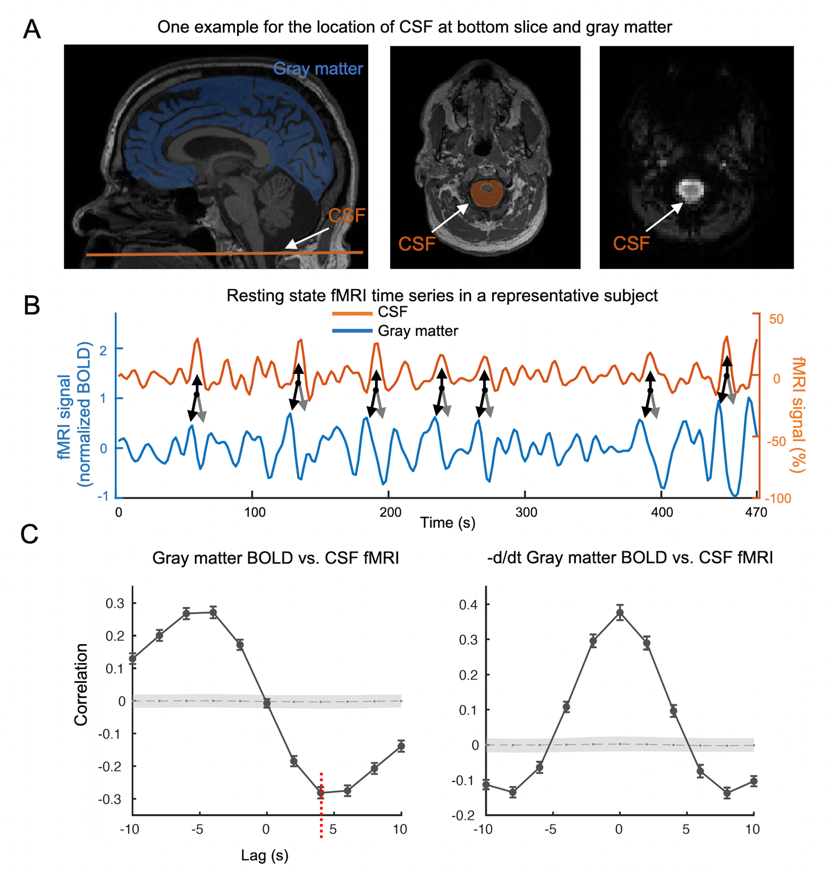
Fig. 1. Global BOLD is coupled with CSF changes. (A) left: global BOLD was averaged across gray matter; middle&right: CSF region at bottom fMRI slice. (B) Coupled changes of global BOLD and CSF signal from an example (indicated with arrows). (C) upper: averaged global BOLD-CSF cross-correlation across 118 subjects; lower: the one for the negative derivative of global BOLD and CSF signal. Shade: 95% confidence interval calculated with shuffled signals16. Error bar: standard error of the mean (SEM).