Sairam Geethanath1, Pavan Poojar1, Keerthi Sravan Ravi1, and Godwin Ogbole2
1Columbia University, New York, NY, United States, 2Department of Radiology, University College Hospital(UCH) Ibadan, Ibadan, Nigeria
1Columbia University, New York, NY, United States, 2Department of Radiology, University College Hospital(UCH) Ibadan, Ibadan, Nigeria
We used native noise structure and level to denoise three different MR data types (T1w and T2w at 3T, T1w at 0.36T) with a peak signal-to-noise ratio greater than 38 dB for training and an image entropy greater than 4.25 for testing with no reference images.
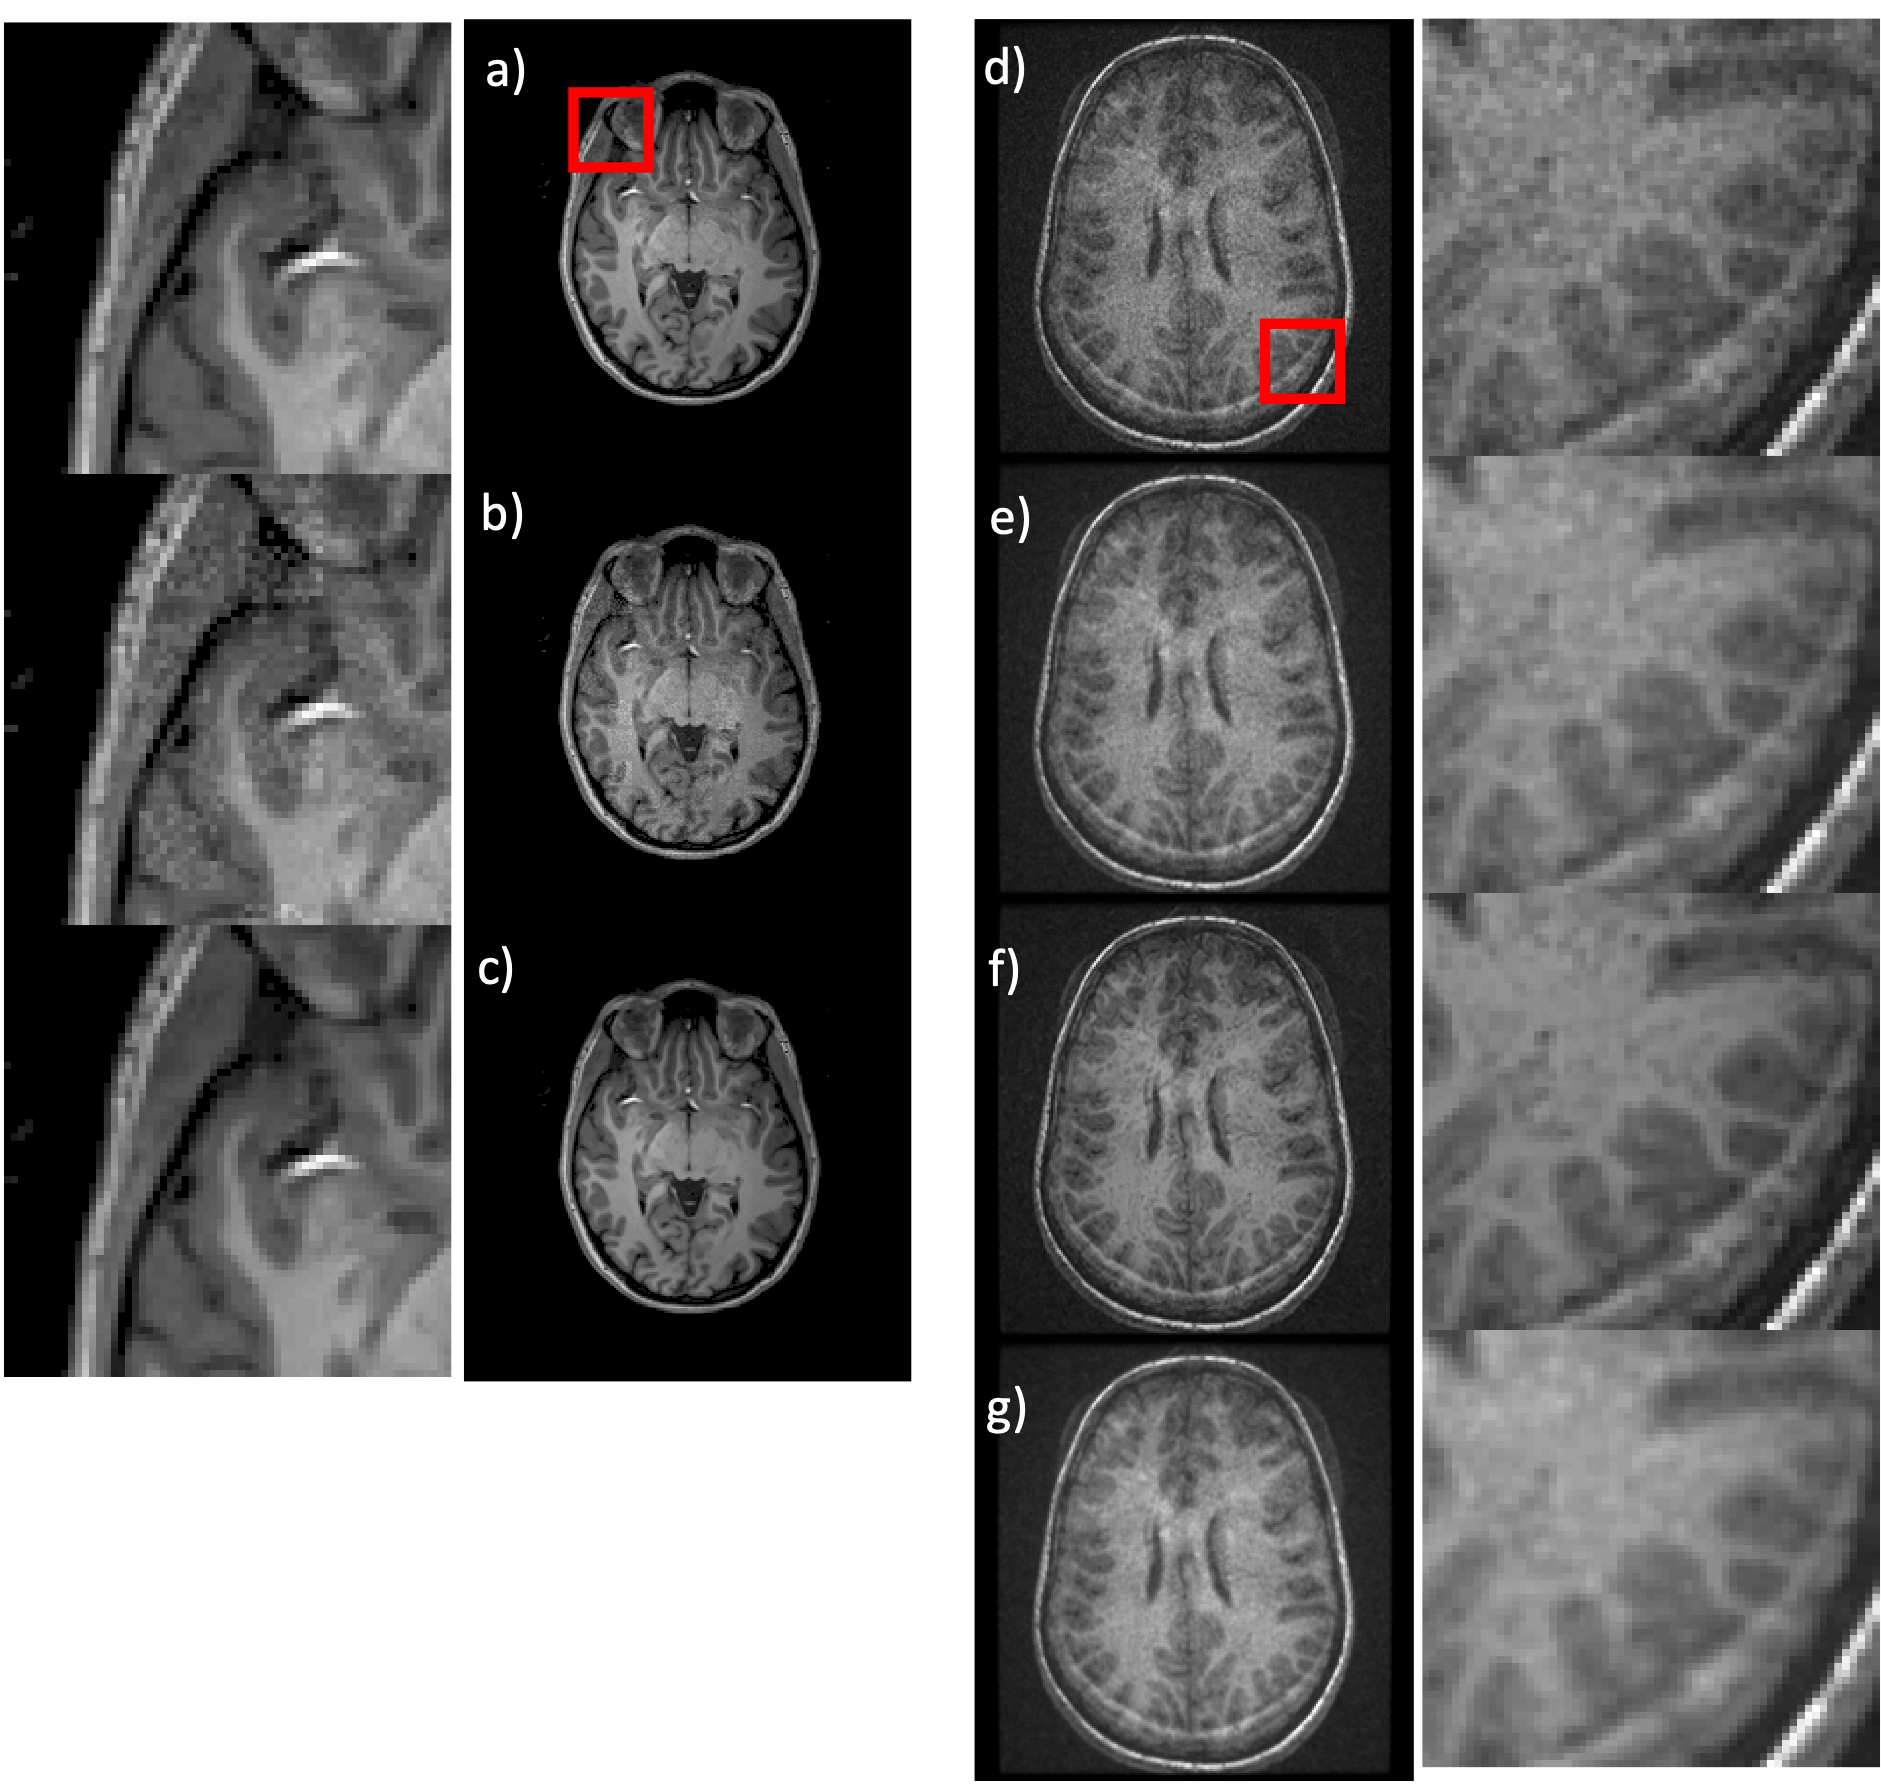
Fig. 4 Denoising low field T1-weighted images: Training (a-c) - a) a representative image used as the gold standard for training; b) noise added image used for the training; c) the output of the native noise denoising network (NNDnet). The corresponding magnified images are shown on the left for the red square shown in a). Testing (d-g) - d) a representative 0.36T noisy image e) gradient anisotropy diffusion denoised (AD) result that is blurry; f) NNDnet denoised image; g) NNDnet + AD denoised image. The right column contains corresponding magnified images
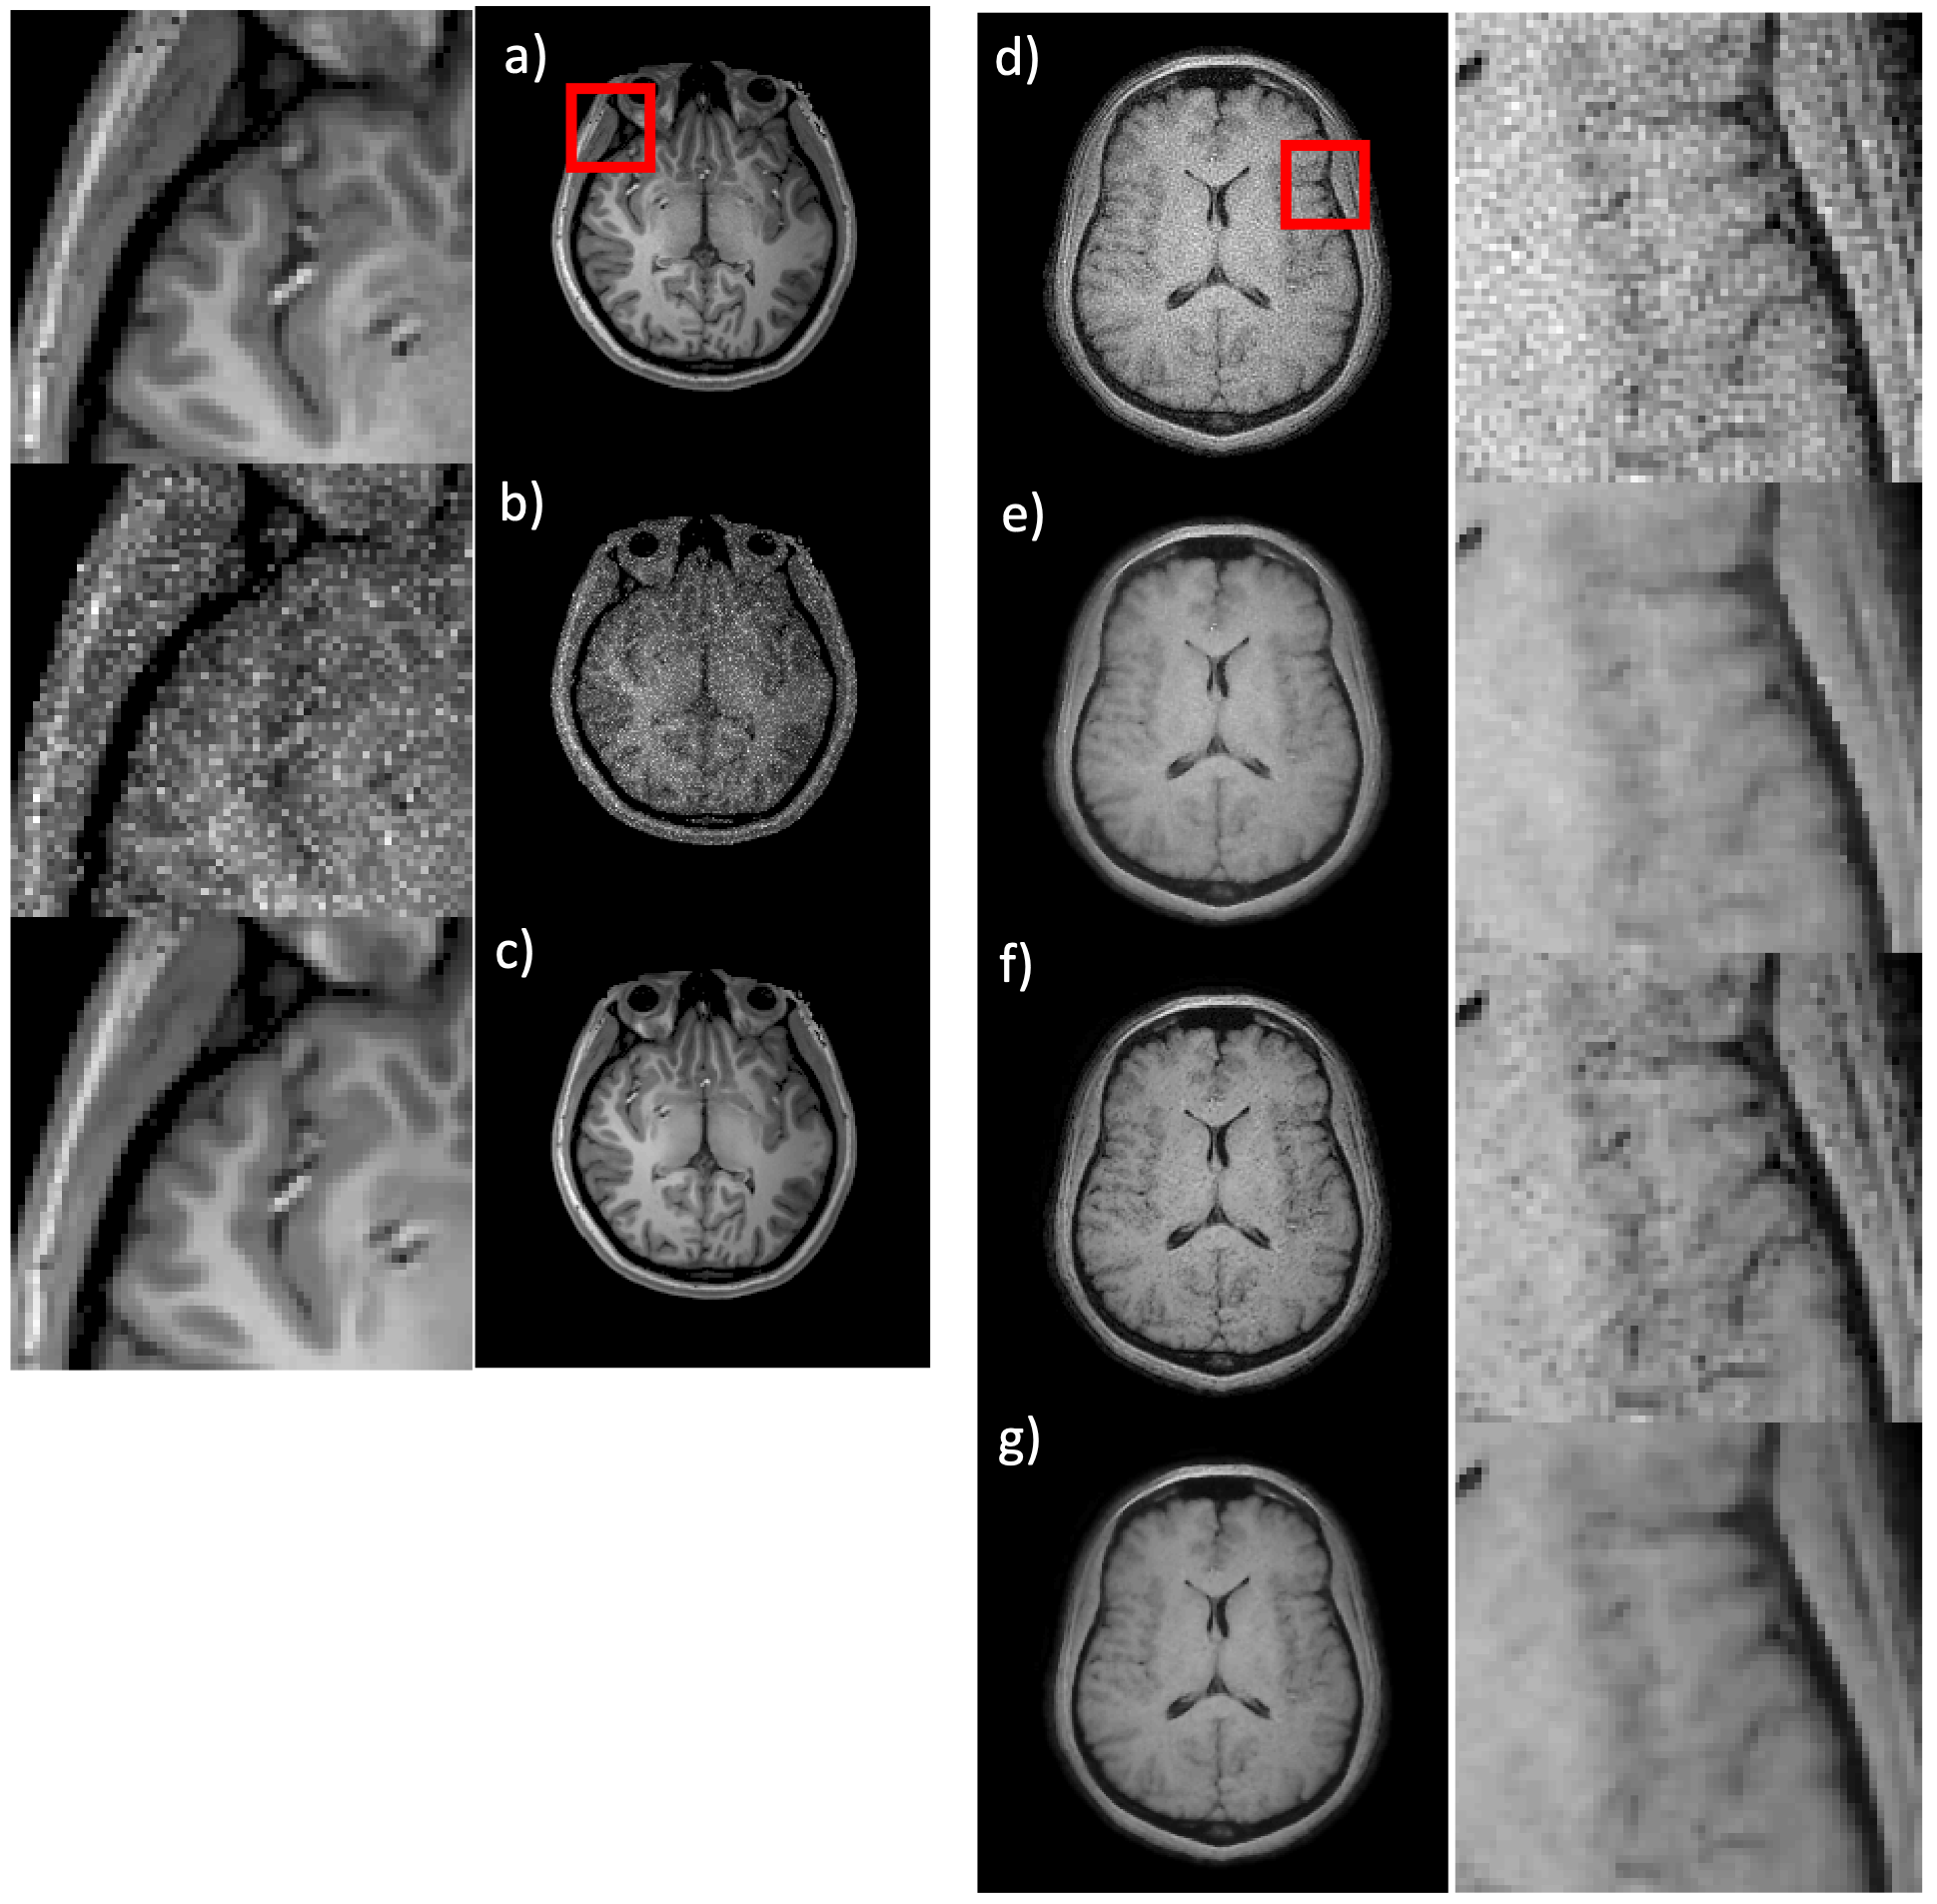
Fig. 2 Denoising tailored MR Fingerprinting (TMRF): Training (a-c) - a) a T1-weighted image from the human connectome database; b) extracted noise from the TMRF data added for training; c) corresponding native noise denoising network (NNDnet) result. The left column shows the corresponding magnified images for the red square shown in a). Testing (d-g) - d) a test TMRF T1 image that suffers from noise e) corresponding gradient anisotropy diffusion denoised (GADD) result; f) NNDnet denoised image; g) NNDnet + GADD denoised image; corresponding magnified images on the right.