Sofie Rahbek1, Kristoffer H. Madsen2,3, Henrik Lundell2, Faisal Mahmood4,5, and Lars G. Hanson1,2
1Department of Health Technology, Technical University of Denmark, Kgs. Lyngby, Denmark, 2Danish Research Centre for Magnetic Resonance, Centre for Functional and Diagnostic Imaging and Research, Copenhagen University Hospital Hvidovre, Hvidovre, Denmark, 3Department of Applied Mathematics and Computer Science, Technical University of Denmark, Kgs. Lyngby, Denmark, 4Laboratory of Radiation Physics, Odense University Hospital, Odense, Denmark, 5Department of Clinical Research, University of Southern Denmark, Odense, Denmark
1Department of Health Technology, Technical University of Denmark, Kgs. Lyngby, Denmark, 2Danish Research Centre for Magnetic Resonance, Centre for Functional and Diagnostic Imaging and Research, Copenhagen University Hospital Hvidovre, Hvidovre, Denmark, 3Department of Applied Mathematics and Computer Science, Technical University of Denmark, Kgs. Lyngby, Denmark, 4Laboratory of Radiation Physics, Odense University Hospital, Odense, Denmark, 5Department of Clinical Research, University of Southern Denmark, Odense, Denmark
We propose a novel monotonous slope non-negative matrix factorization for extraction of tissue-related signal components from high-dimensional MRI data. Applications of the method are demonstrated using both diffusion-weighted and relaxometry data.
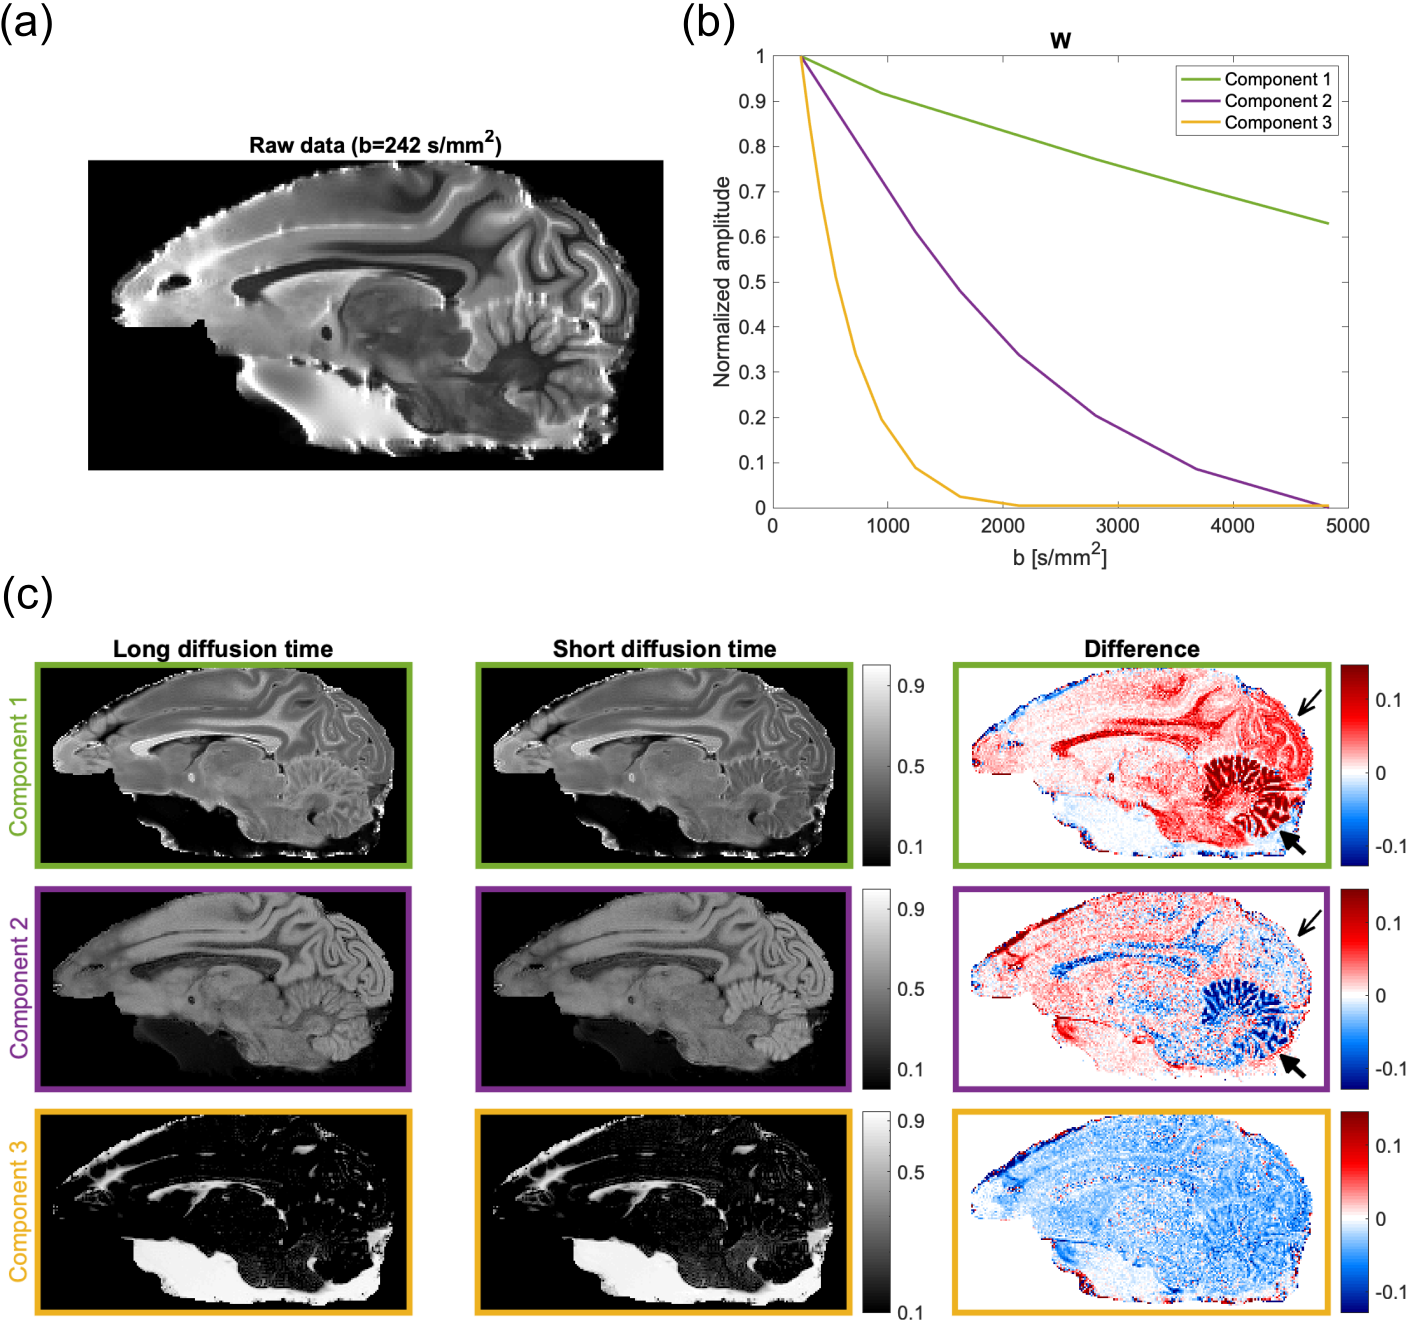
(a): Example of a measured image of the monkey brain. (b): The signal components, W, from the msNMF. (c): The associated normalized mixture maps, H, labelled by the frame colors. A logarithmic color scale is used for the yellow component. Maps are given for both data sets and the right column shows the difference between the two (Short diffusion time subtracted from long diffusion time). The thin and thick black arrows mark the conspicuous visual cortex and cerebellum, respectively.
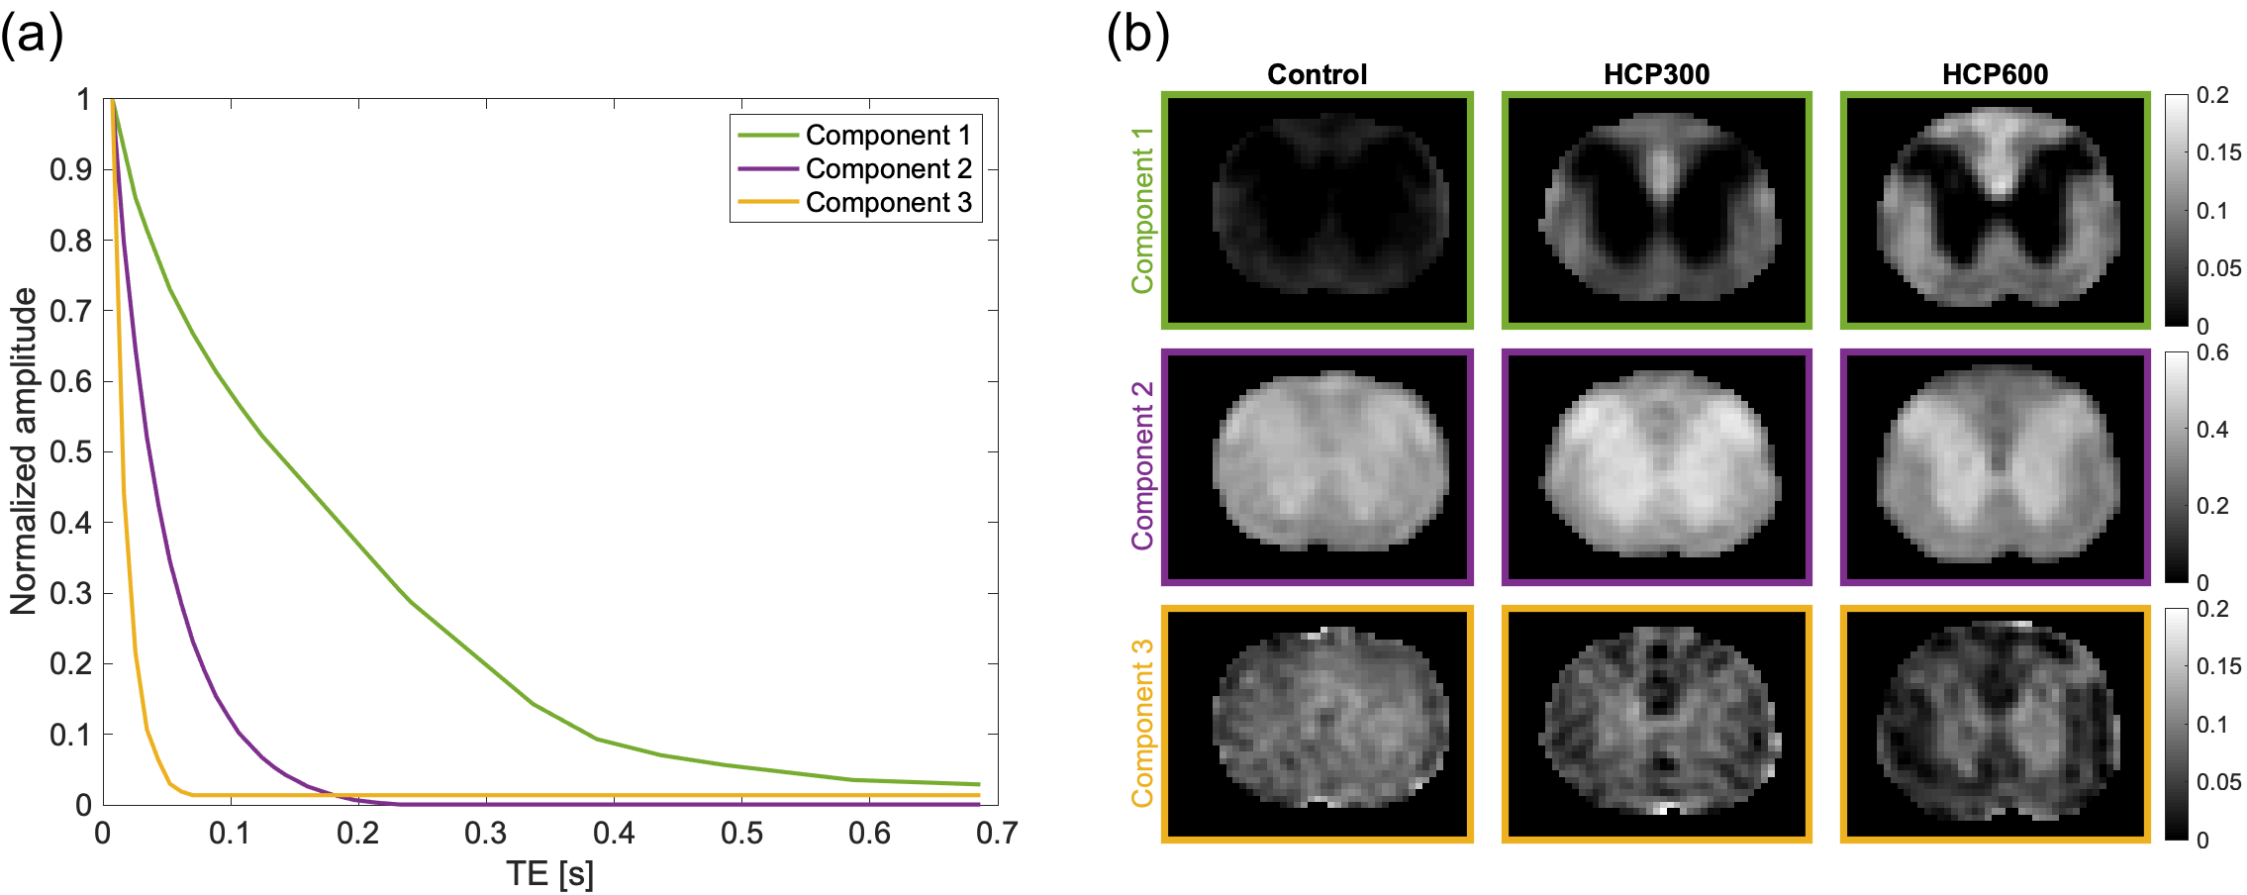
Result of the msNMF for the relaxometry data of rat spinal cord. (a): The signal components, W. (b): The associated mixture maps, H, indicated by the frame and label colors. Each column of images shows the maps for a specific rat (one from each group).