Amer Ajanovic1, Joseph V Hajnal1,2, Raphael Tomi-Tricot1,3, and Shaihan Malik1
1Biomedical Engineering Department, School of Biomedical Engineering and Imaging Sciences, King's College London, London, United Kingdom, 2Centre for the Developing Brain, School of Biomedical Engineering and Imaging Sciences, King's College London, London, United Kingdom, 3MR Research Collaborations, Siemens Healthcare Limited, Frimley, United Kingdom
1Biomedical Engineering Department, School of Biomedical Engineering and Imaging Sciences, King's College London, London, United Kingdom, 2Centre for the Developing Brain, School of Biomedical Engineering and Imaging Sciences, King's College London, London, United Kingdom, 3MR Research Collaborations, Siemens Healthcare Limited, Frimley, United Kingdom
The pose-study produced more stable SAR results than the motion study. In the motion study’s extreme cases where the estimated plSAR is high, the true plSAR is even higher; however, in most scenarios, they are similar.
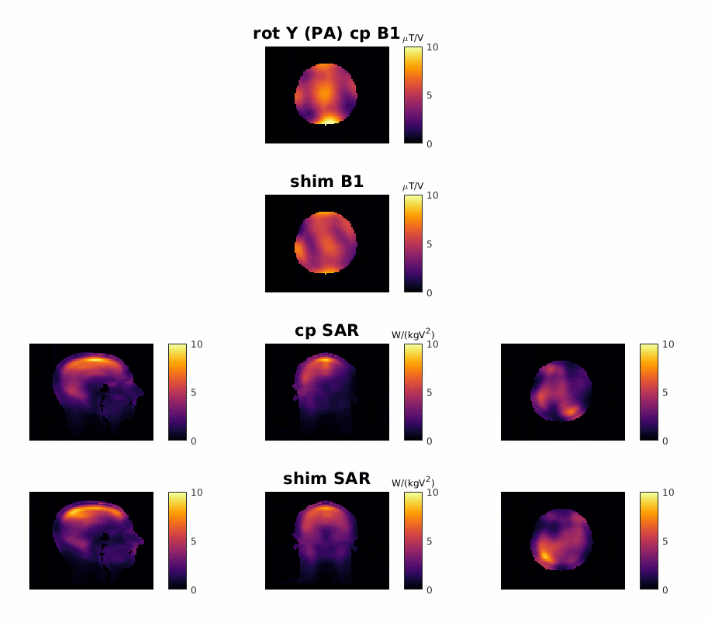
Motion study B1 and SAR maps for a randomly selected position.
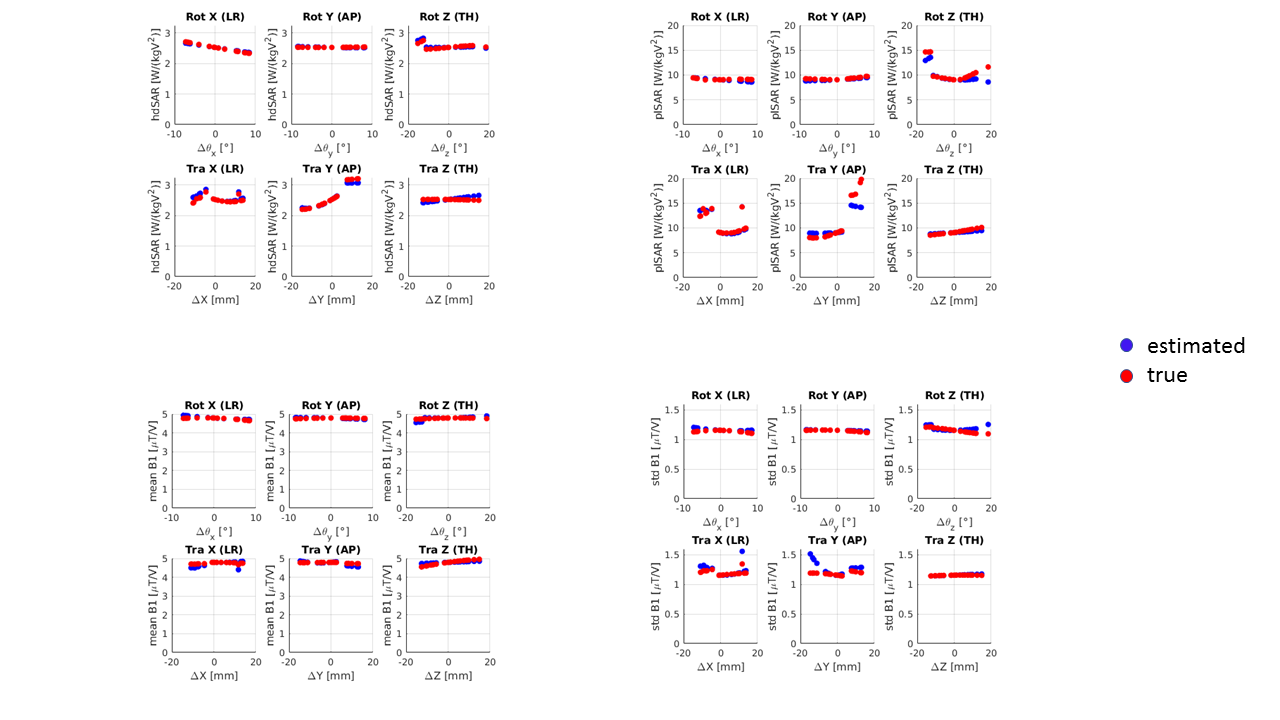
Pose study across all perturbation states for the estimated values (blue) and the true values (red). Top left: head averaged SAR, top right: peak local SAR, bottom left: mean B1+, bottom right: standard deviation of B1+.
The blue points indicate the SAR that would be estimated from an unperturbed model while the red points show the ‘true’ SAR from the true model.