Soham Mukherjee1, Mahon L Maguire1, Jack Sharkey1, Sourav Bhaduri1, Patricia Murray2, Rachel Bearon3, Bettina Wilm2, and Harish Poptani1
1Centre for Preclinical Imaging, University of Liverpool, Liverpool, United Kingdom, 2Department of Cellular and Molecular Physiology, University of Liverpool, Liverpool, United Kingdom, 3Department of Mathematical Sciences, University of Liverpool, Liverpool, United Kingdom
1Centre for Preclinical Imaging, University of Liverpool, Liverpool, United Kingdom, 2Department of Cellular and Molecular Physiology, University of Liverpool, Liverpool, United Kingdom, 3Department of Mathematical Sciences, University of Liverpool, Liverpool, United Kingdom
Dynamic contrast enhanced magnetic resonance
imaging was used to determine the permeability parameter Ktrans, to
assess renal function.
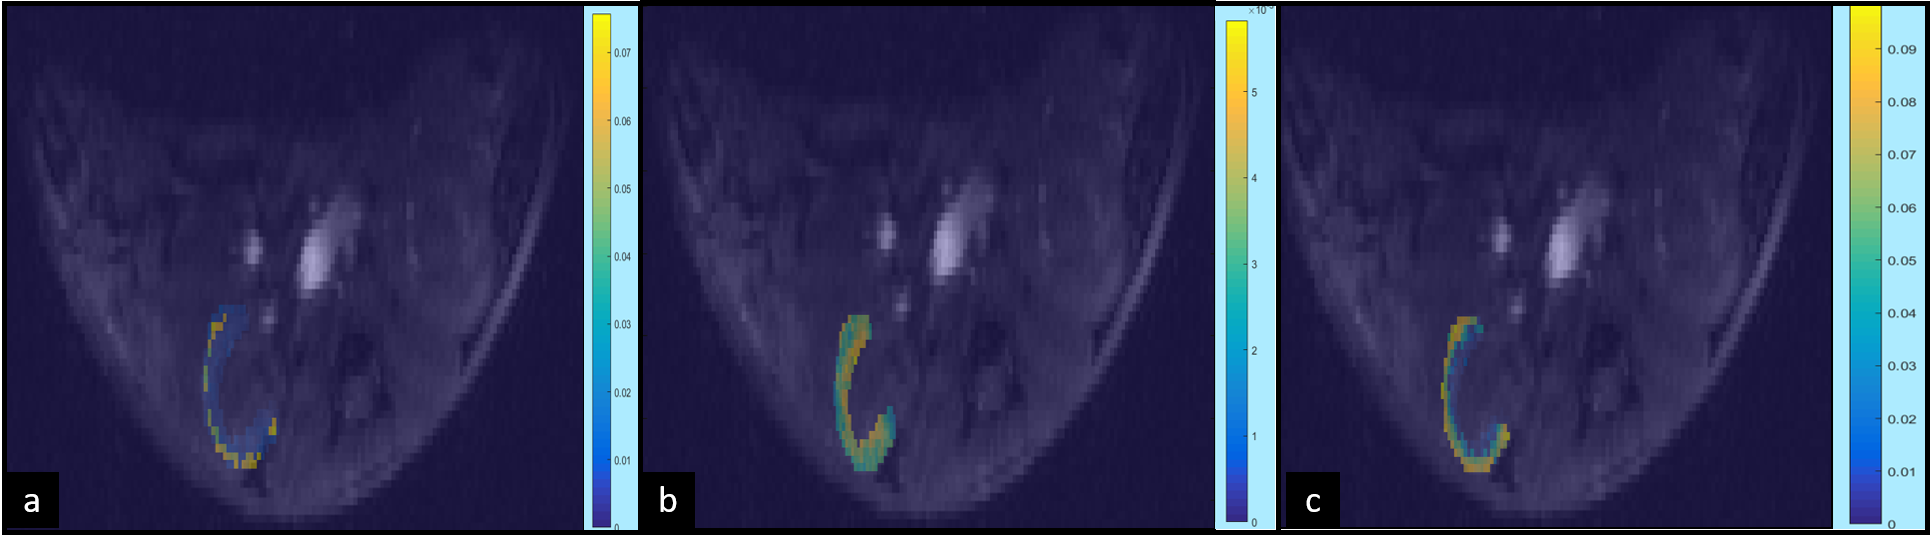
Fig. 1: Ktrans (s-1) maps of the cortical region overlaid on the left kidney of a mouse. The raw AIF
was used to compute the Ktrans maps using the non-linear Tofts (a), extended
Tofts (b), and the SSM (c).
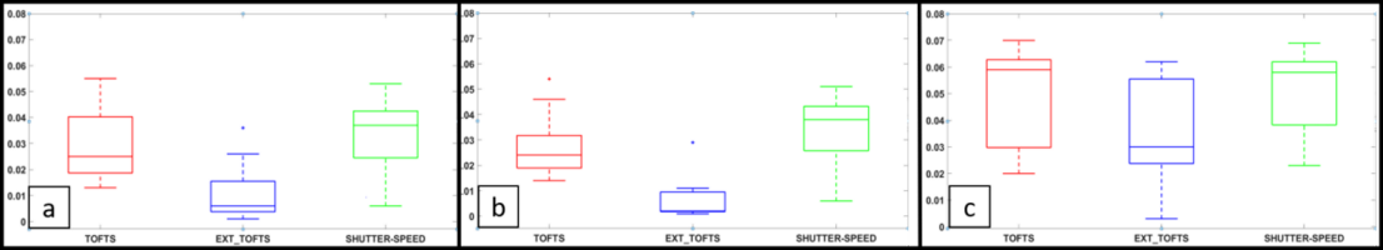
Fig. 2: Boxplot of mean Ktrans (s-1)values
from fitting of nonlinear Tofts, extended Tofts and SSM using AIF derived from
(a) raw data, (b) SSA denoising, and (c) bi-exponential fitting.