Anneloes de Boer1, Bashair Al Hummiany2, Kanishka Sharma3, and Steven Sourbron3
1University Medical Center Utrecht, Utrecht, Netherlands, 2University of Leeds, Leeds, United Kingdom, 3University of Sheffield, Sheffield, United Kingdom
1University Medical Center Utrecht, Utrecht, Netherlands, 2University of Leeds, Leeds, United Kingdom, 3University of Sheffield, Sheffield, United Kingdom
A 7-compartment model was developed to measure medullary
perfusion using MR renography and validated using simulations. In diabetic
patients, the model produced relatively high medullary perfusion values of 81 mL/100mL/min.
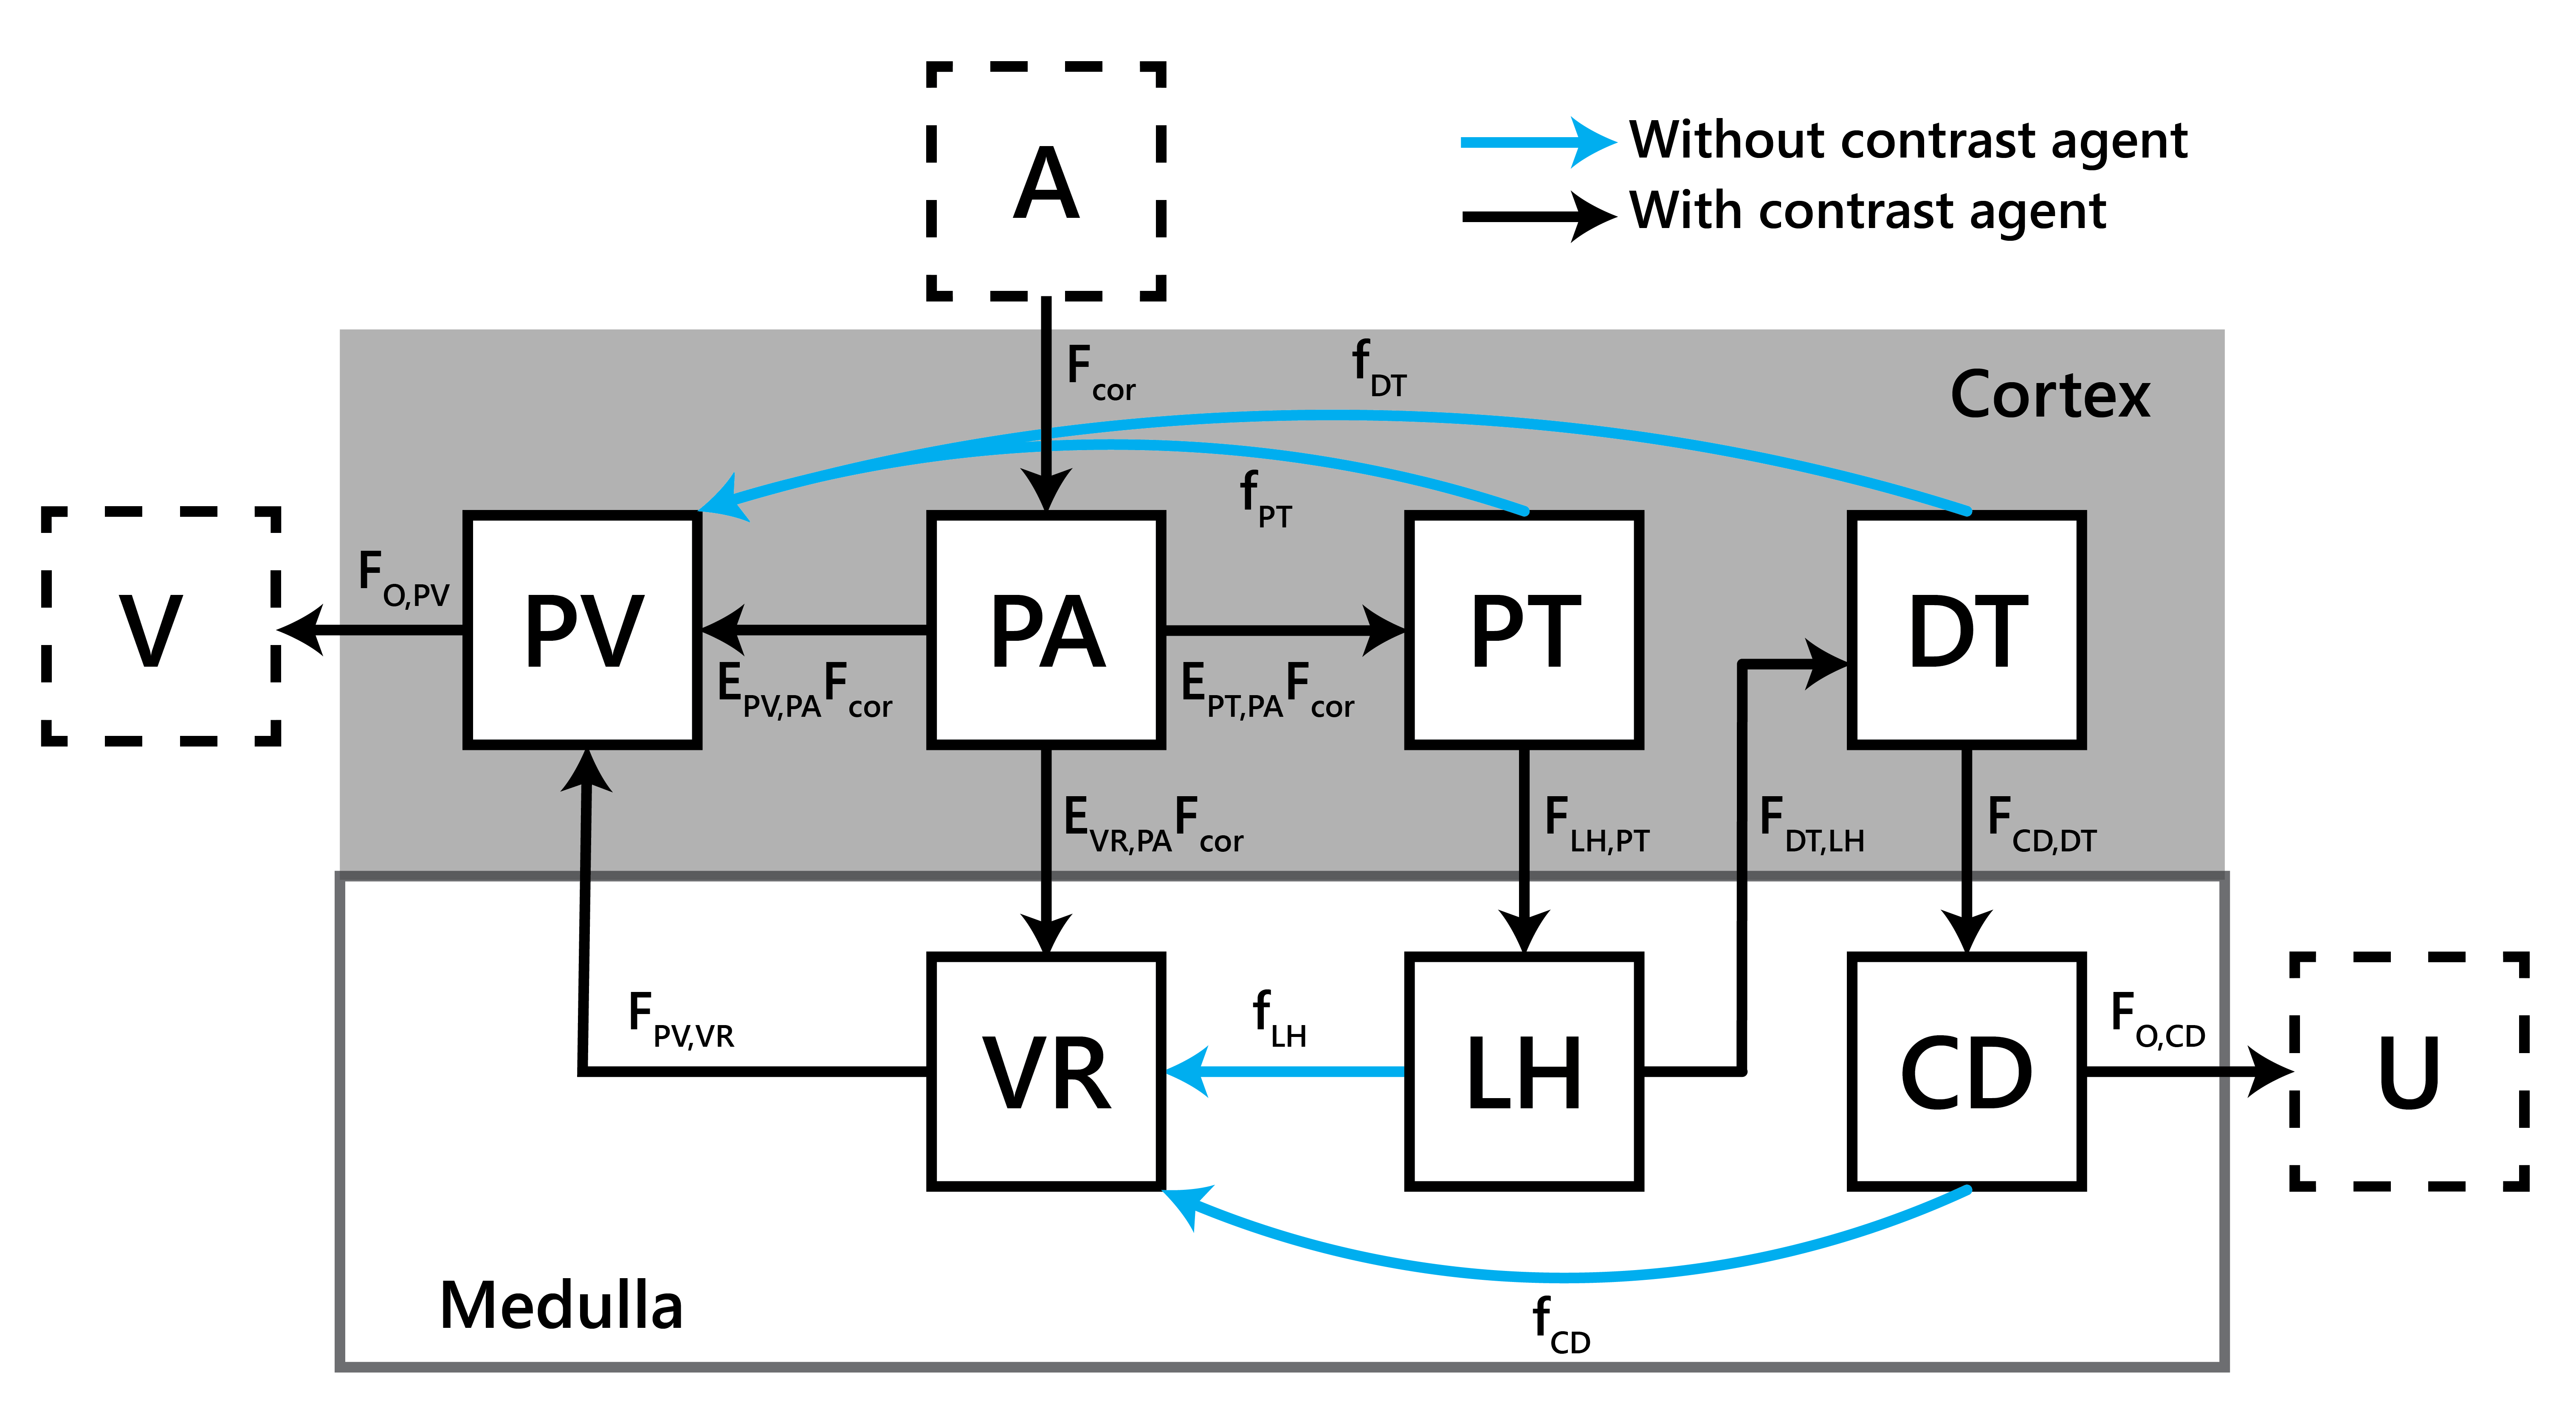
Figure 1: The
7 compartment model;
Fmed=EVR,PAFcor
. A aorta;
V renal veins; PV venous plasma compartment (low pressure vascular spaces
including veins and peritubular capillaries); PA arterial plasma compartment
(high pressure vascular spaces including arteries and glomeruli); PT proximal
tubules; DT distal tubules; VR vasa recta; LH loop of Henle; CD collecting ducts; U urine. The blue arrows
represent reabsorption flows carrying mainly water but no contrast agent.
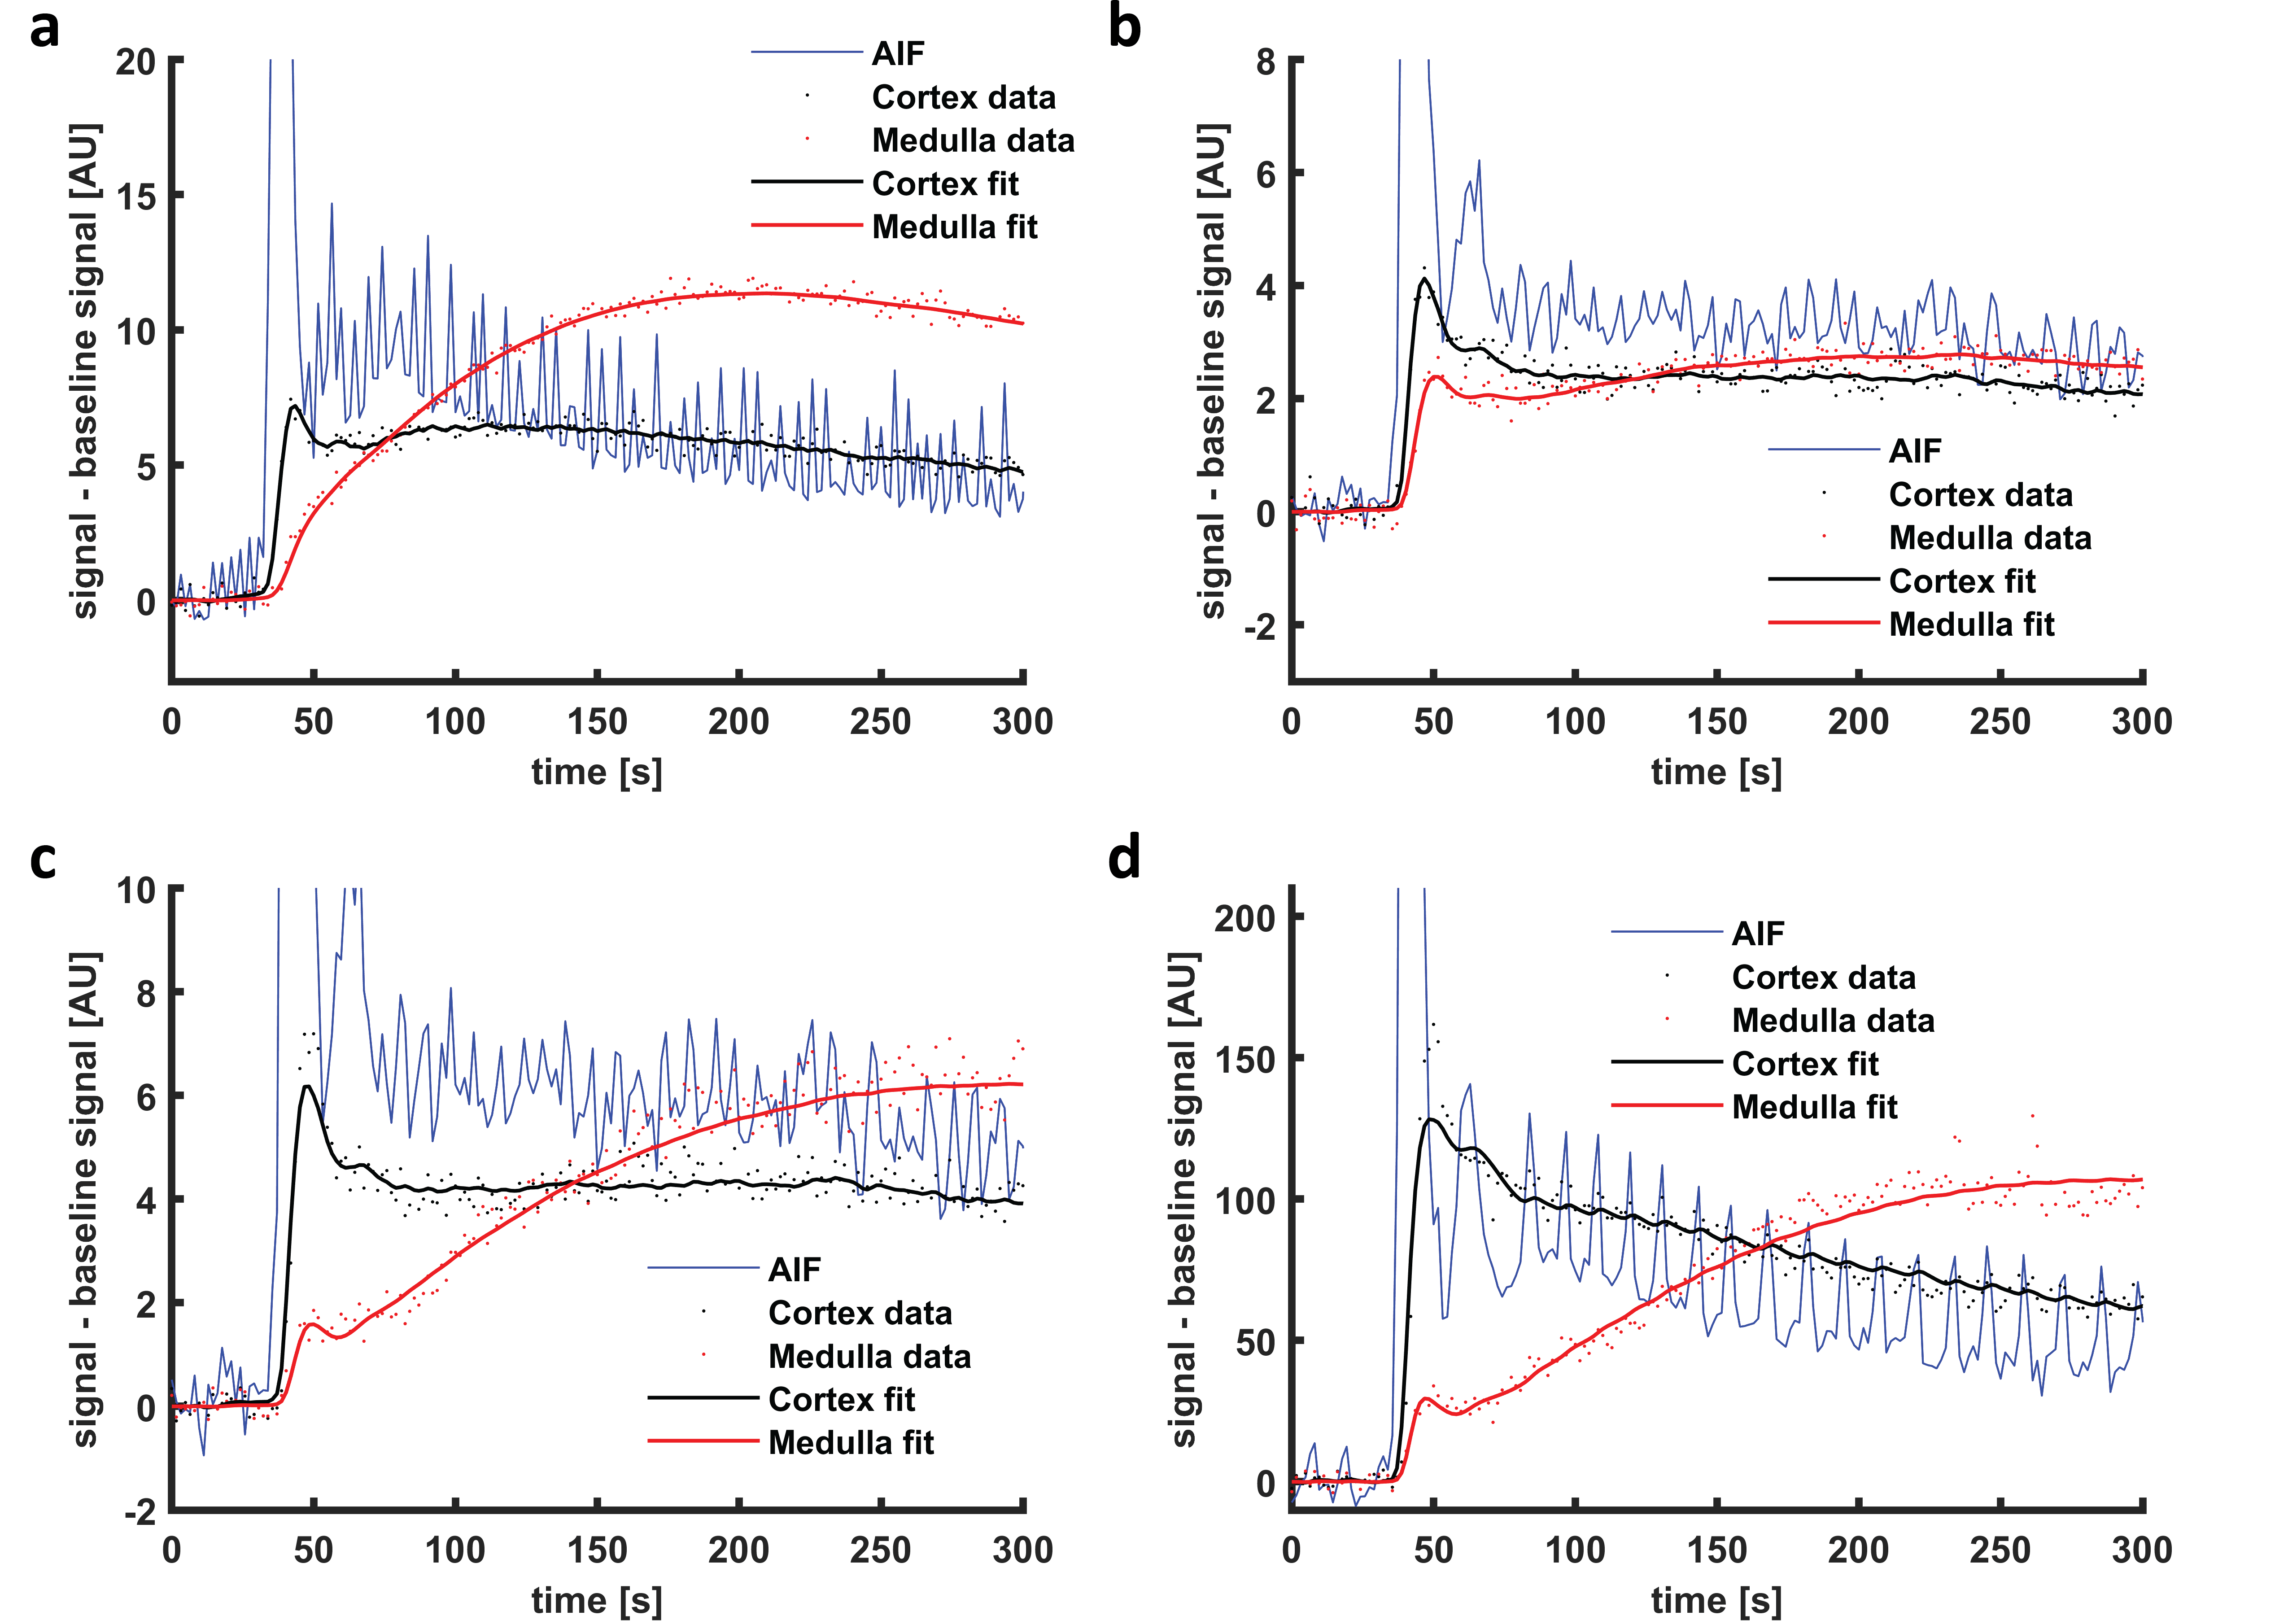
Figure 3: Example
of a and b) a 7CM fit to simulated
data and c and d) a 7CM fit to
patient data (only the first 300 s are shown). Note that the model fits the
first pass peak well in simulated data, while it is not capable to capture the
full height of the first pass peak in patient data. The oscillations on the AIF
are due to inflow effects.