Feng Wang1,2, Tadashi Otsuka3, Zhongliang Zu1,2, Mark P de Caestecker3, Raymond C Harris3, Takamune Takahashi3, and John C Gore1,2
1Vanderbilt University Institute of Imaging Science, Vanderbilt University Medical Center, Nashville, TN, United States, 2Department of Radiology and Radiological Sciences, Vanderbilt University Medical Center, Nashville, TN, United States, 3Division of Nephrology and Hypertension, Vanderbilt University Medical Center, Nashville, TN, United States
1Vanderbilt University Institute of Imaging Science, Vanderbilt University Medical Center, Nashville, TN, United States, 2Department of Radiology and Radiological Sciences, Vanderbilt University Medical Center, Nashville, TN, United States, 3Division of Nephrology and Hypertension, Vanderbilt University Medical Center, Nashville, TN, United States
MRI measures such as pool size ratio, relaxation rates, and parameters derived from R1ρ dispersion are sensitive to tubular atrophy and fibrosis in kidneys. Spin-lock MRI provides parameters with higher sensitivity than R1 and R2.
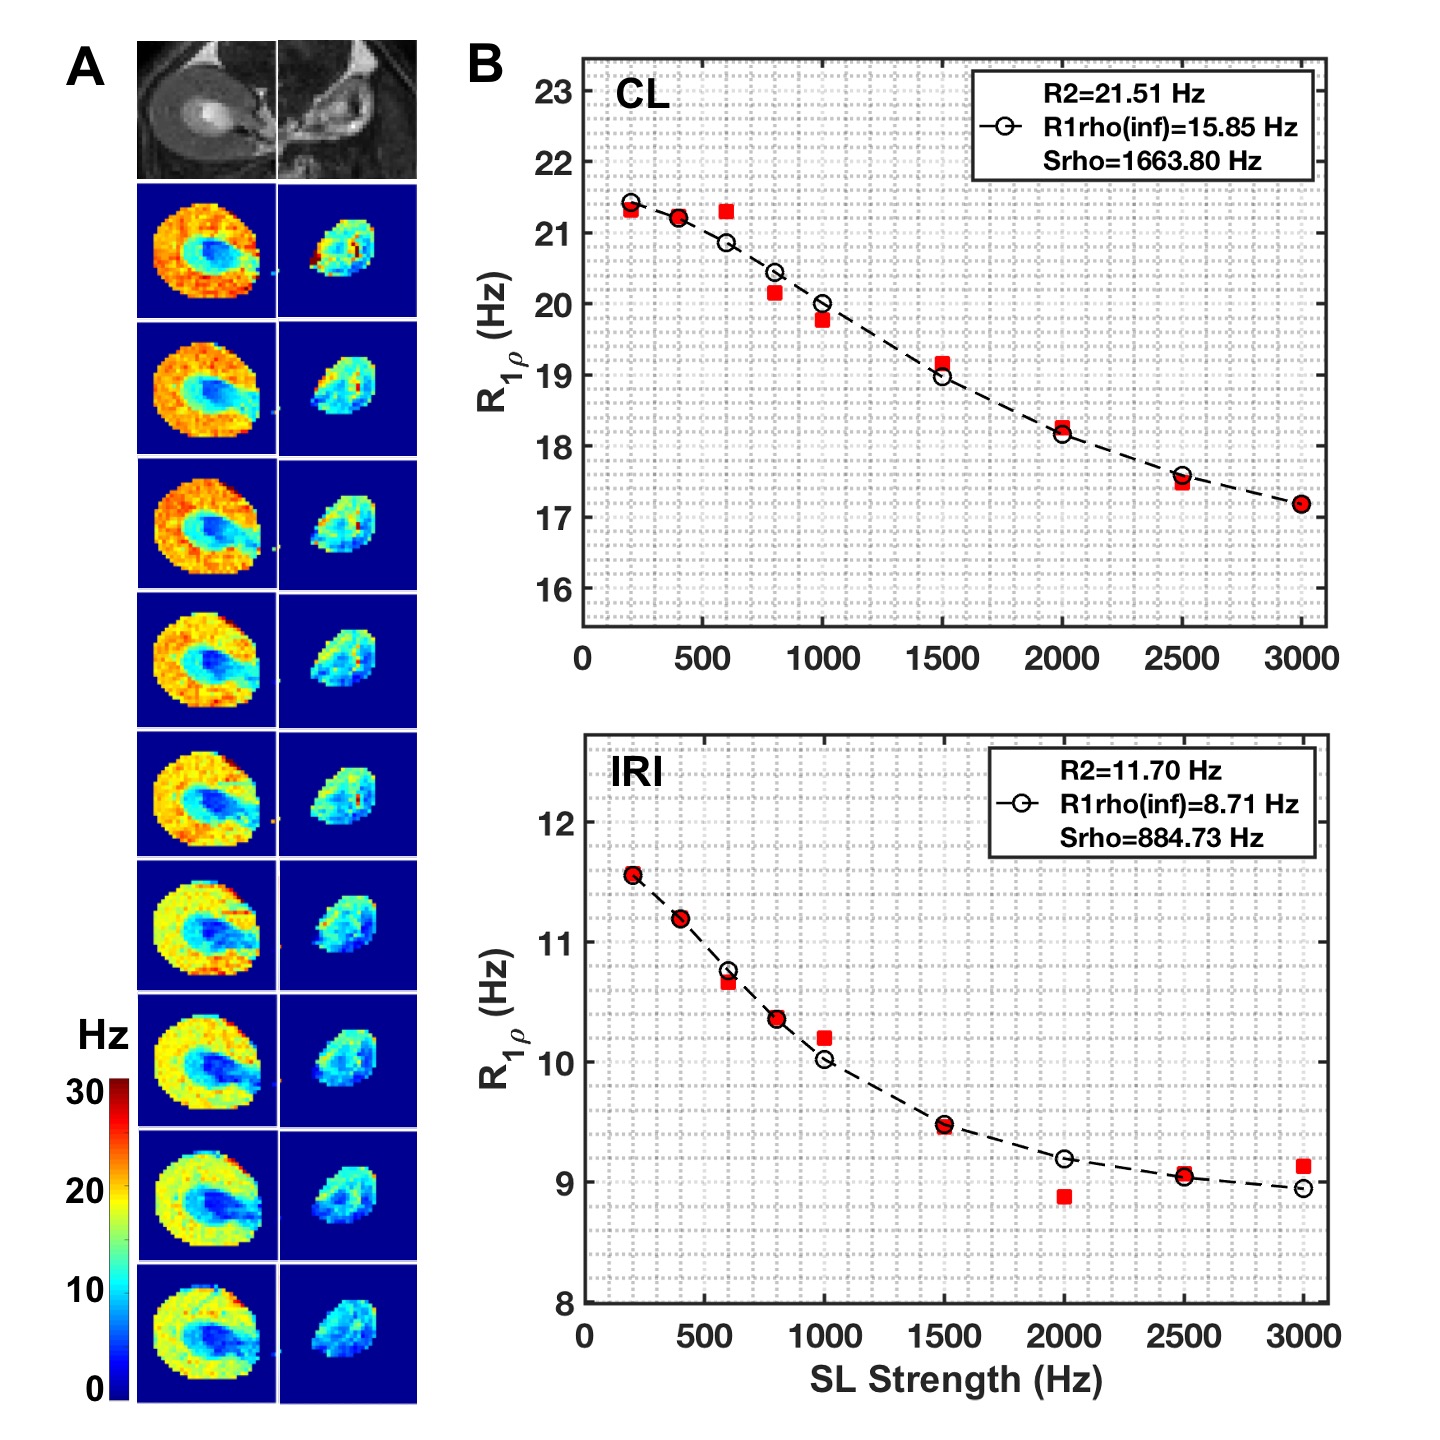
Figure 4. Comparison of representative in vivo R1ρ dispersion between CL and IRI kidneys. (A) T2-weighted images (T2W) and R1ρ maps at different spin-locking strength with locking frequency from 200 to 3000 Hz (top to bottom). (B) Comparison of R1ρ dispersions between CL and IRI kidneys. The parameters were derived from Chopra model, with fitting results from SL strength ranges 200-3000 Hz shown. Cortex and OSOM were included to calculate the averaged R1ρ at each spin-lock strength for further fitting.
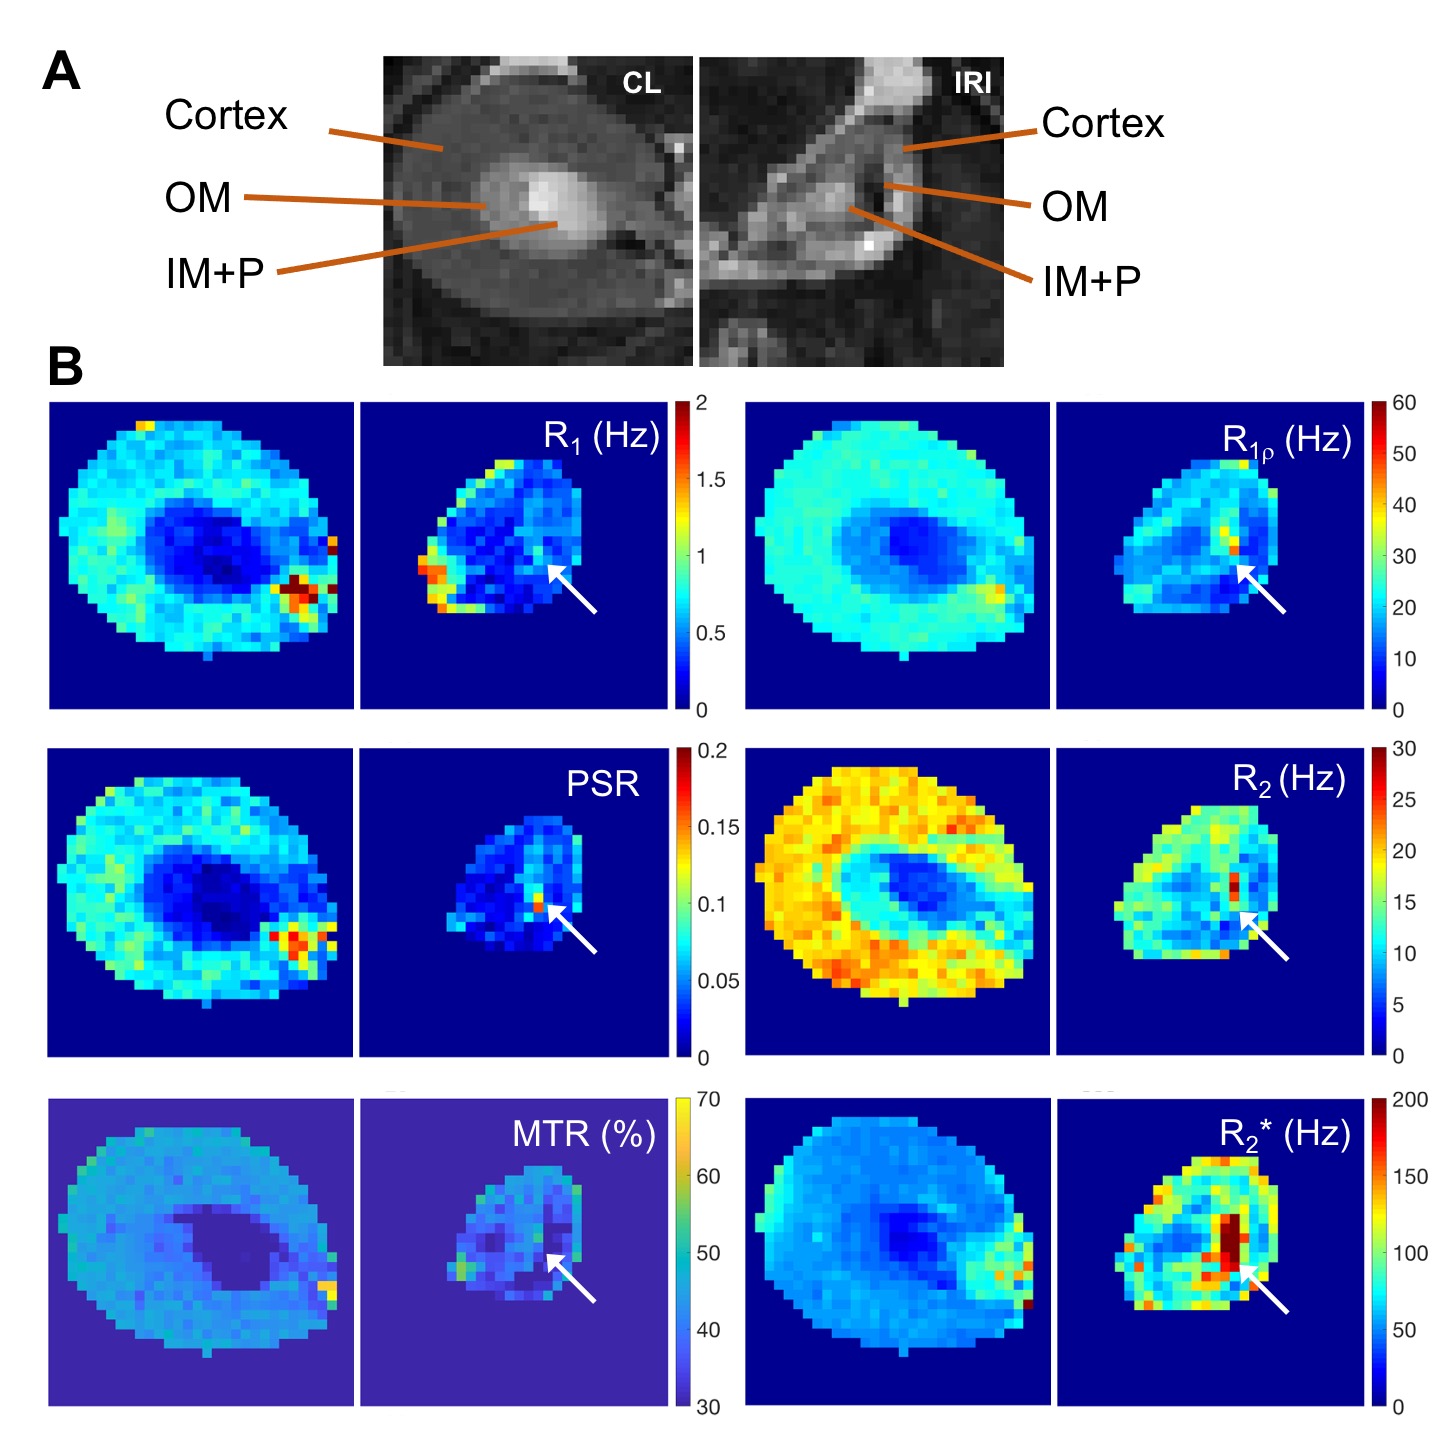
Figure 5. Representative comparison of MRI images and maps of CL and IRI kidneys. (A) T2-weighted (T2W) images zoomed on CL and IRI kidneys. (B) R1, R1ρ (spin-lock frequency 1000 Hz), R2, R2*, pool size ratio (PSR) from quantitative magnetization transfer (qMT) modeling, and magnetization transfer ratio (MTR) based on images without and with magnetization transfer saturation (flip angle 820 degree and RF offset 5000 Hz). The arrows indicate outer medulla.