Haoyang Jiang1, Ailian Liu2, Ye Ju2, Jiazheng Wang3, Changyu Du1, Lingli Qi1, Xinmiao Bu2, Wenjun Hu2, Nan Wang2, and Liangjie Lin3
1Dalian Medical University, Dalian, China, 2The First Affiliated Hospital Of Dalian Medical University, Dalian, China, 3Philips Healthcare, Beijing, China
1Dalian Medical University, Dalian, China, 2The First Affiliated Hospital Of Dalian Medical University, Dalian, China, 3Philips Healthcare, Beijing, China
In summary, the R2* value
and fat fraction by mDIXON-Quant may help clinical diagnosis of CKD with
quantitative evaluation of hypoxia and lipid deposition in renal tissues.
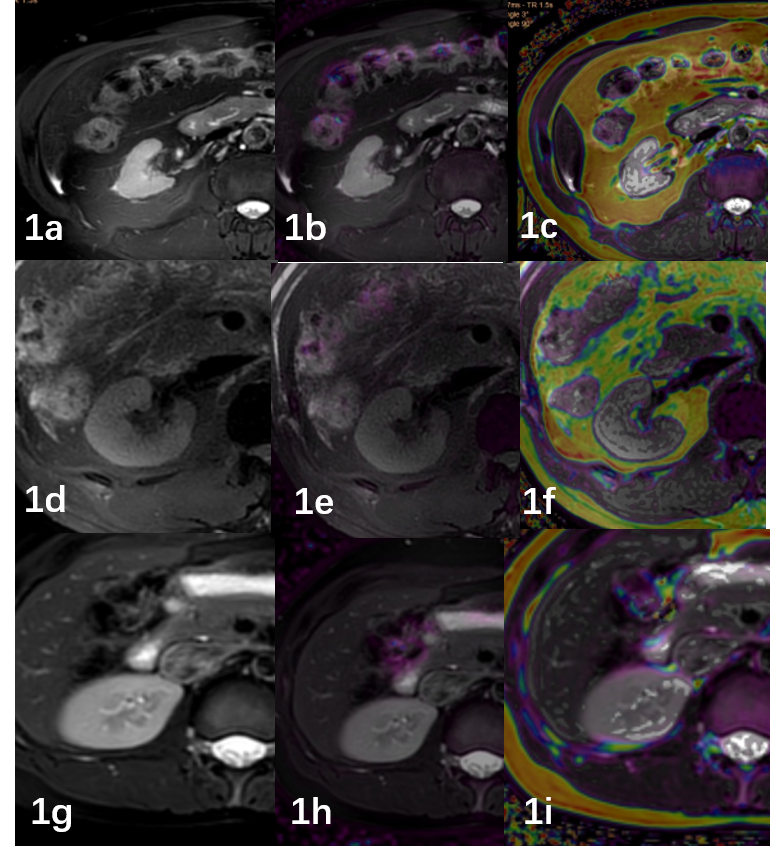
Fig1. A 50-year-old male with CKD grade 5,eGFR was 7.87ml/min (1a). T2WI image. (1b)R2* image (1c). FF image.
A 40-year-old male with CKD grade 1,eGFR was 124.09ml/min (1d). T2WI image. (1e)R2* image (1f). FF image
A 31-year-old female volunteer (1g). T2WI image. (1h)R2* image (1i). FF image

Fig2. Diagnostic efficiency curve of the R2* values in heathy controls and mild CKD patients (2a).
Diagnostic efficiency curve of the R2* values in heathy controls and acute CKD patients (2b).
Diagnostic efficiency curve of the FF values in mild CKD patients and acute CKD patients (2c).