Jiaxin Yan1, Weiqiang Dou2, Hongmei Gu1, Xinquan Wang1, Weiyin Vivian Liu2, Huijian Lu1, Ying Zhou1, Xuejun Zhou1, and LI Yuan1
1Affiliated Hospital of Nantong University, Nantong, China, 2GE Healthcare, MR Research China, Beijing, China
1Affiliated Hospital of Nantong University, Nantong, China, 2GE Healthcare, MR Research China, Beijing, China
T1 mapping combined with BOLD-MRI derived R2* mapping might provide an effective method in assessing renal function.
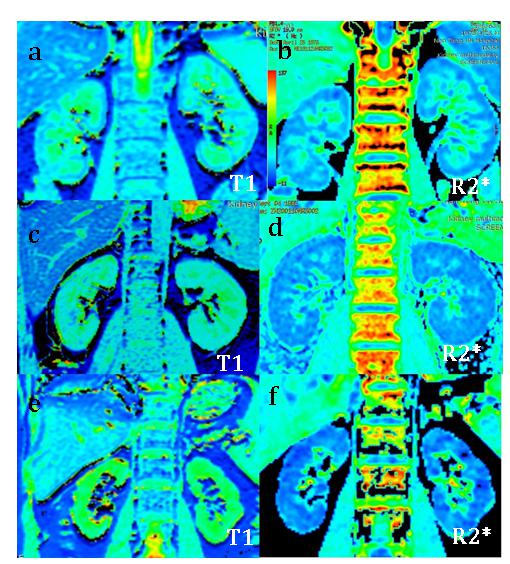
Fig.1
Representative T1 and
R2* mapping of the normal (a,b), the mild (c,d)
and the moderate to severe patients (e,f) were shown.
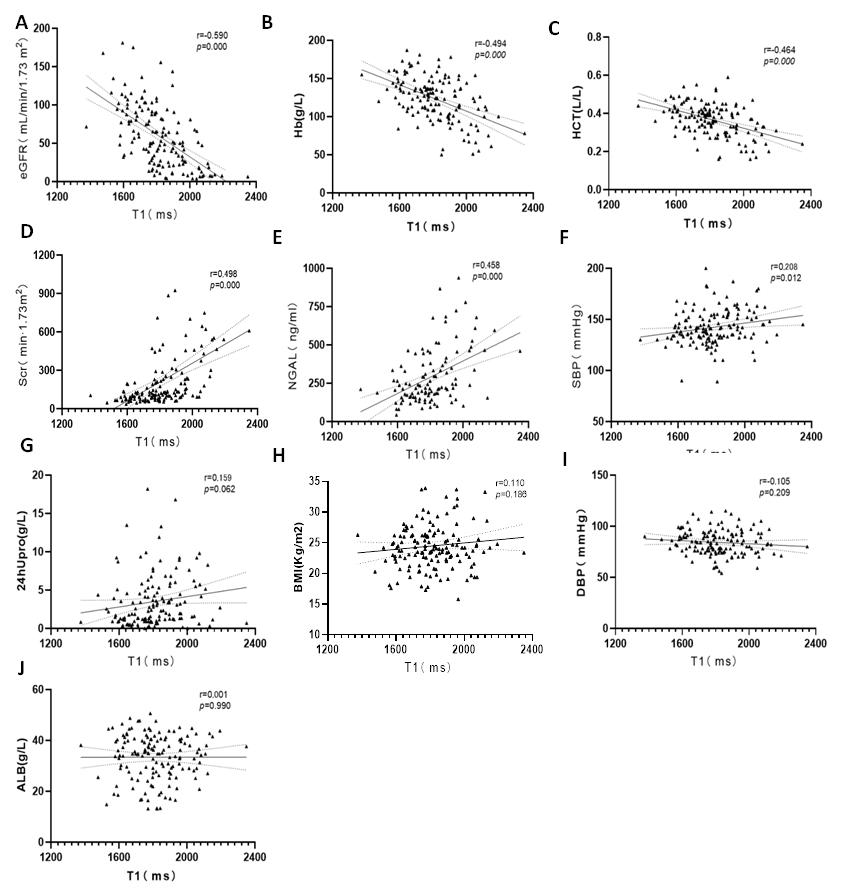
Fig. 3
A-C:T1 value was negatively correlated with
eGFR, Hb and HCT(p<0.05);
D-F:T1 value was
positively correlated with the NGAL, Scr, SBP(p<0.05); G-J: T1 value has no correlation with
24hUpro, BMI, DBP
and ALB.