Zhaoyu Shi1, Fangfang Shang1, Xinquan Wang1, Hongmei Gu1, Xiaoyan Liu1, Weiqiang Dou2, Weiyin Vivian Liu2, Yuan Zhang1, Jianhua Wu1, and Li Yuan1
1Affiliated Hospital of Nantong University, Nantong, China, 2GE Healthcare, MR Research China, Beijing, China
1Affiliated Hospital of Nantong University, Nantong, China, 2GE Healthcare, MR Research China, Beijing, China
Native T1-mapping demonstrated good diagnostic
performance in evaluation of renal function and non-invasive detection of fibrosis in
chronic
glomerulonephritis patients.
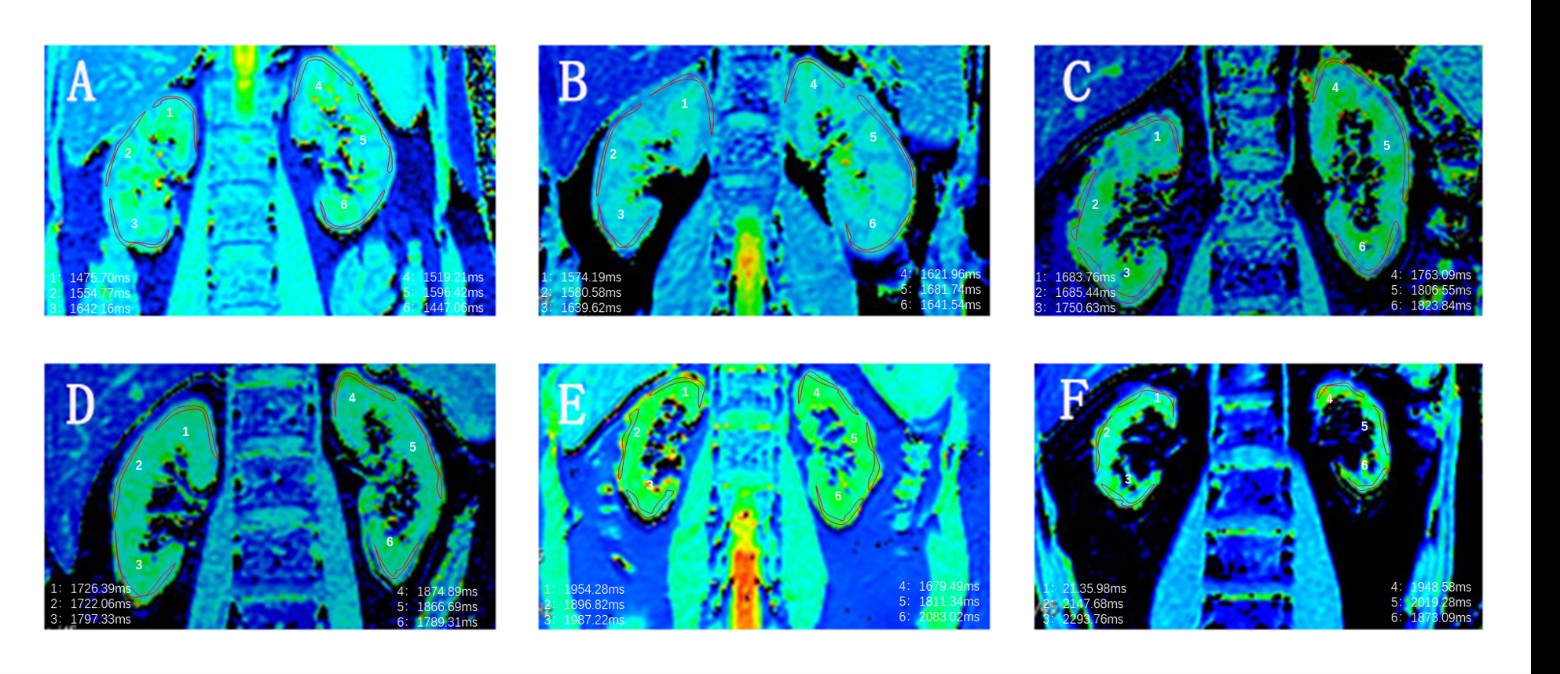
Fig.1
Renal T1 maps. A: Coronal native T1 map of two kidneys of a healthy subject,
T1=1539ms. B: CKD stage 1, T1=1622ms. C: CKD stage 2, T1=1751ms. D: CKD stage
3, T1=1796ms. E: CKD stage 4, T1=1902ms. F: CKD stage 5, T1=2068ms.
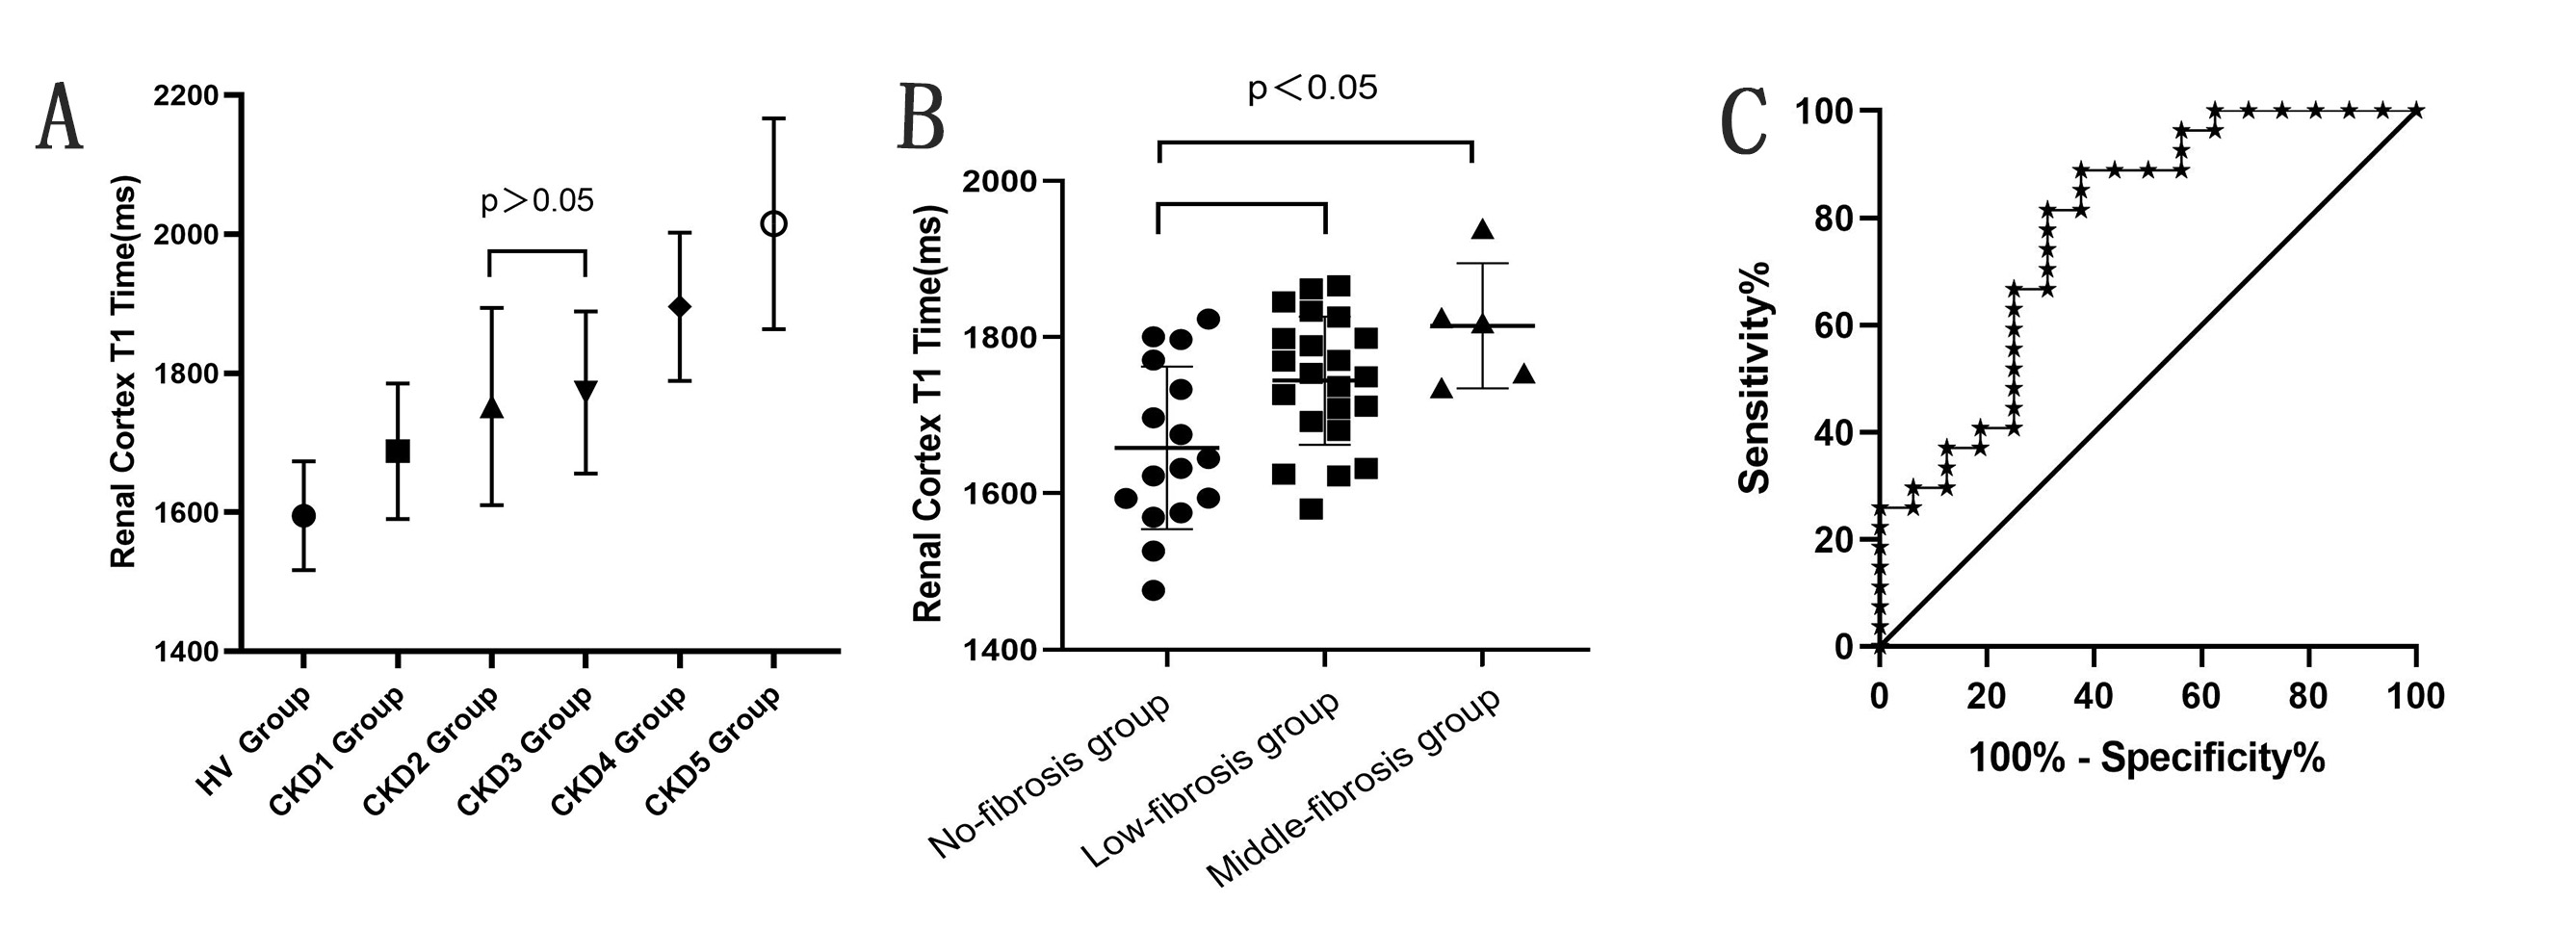
Fig.2 A: T1 value of renal cortex was significantly lower in
the HC group than in CKD patients(F=29.62, P<0.001). Statistical differences of
T1 values were found between CKD stages except for stage 2 and 3 (p<0.05).
B: Compared to non-fibrosis group, T1 value increased in the low and medium
fibrosis group (p<0.05). C: The area under the ROC curve of T1 value for the
prediction of IF is 0.762, and the optimal cutoff value of T1 is 1695 ms.