Ye Ju1, Ailian Liu1, Jiazheng Wang2, Wenjun Hu1, Changyu Du3, Lingli Qi3, Haoyang Jiang3, Xinmiao Bu1, Nan Wang1, and Peng Sun2
1First Affiliated Hospital of Dalian Medical University, Dalian, China, 2Philips Healthcare, Beijing, China, 3Dalian Medical University, Dalian, China
1First Affiliated Hospital of Dalian Medical University, Dalian, China, 2Philips Healthcare, Beijing, China, 3Dalian Medical University, Dalian, China
The AUC, sensitivity and specificity of APT combined R2* were 0.925, 88% and 100%, respectively. The combination of APT and R2* can improve the diagnostic ability of discriminating CKD from HVs, which has certain clinical application value.
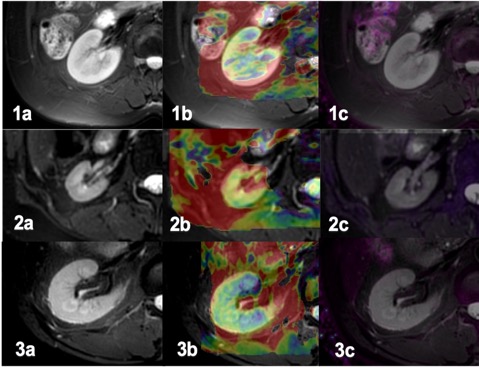
Figure 1. A 55-year-old female volunteer. T2w image (1a), APT image(1b), R2* image(1c). A 34-year-old female with CKD grade 5, eGFR was 3.96, T2w image (2a), APT image(2b), R2* image(2c). A 59-year-old male with CKD grade 1, eGFR was 114.58. T2w image (3a), APT image(3b), R2* image(3c).
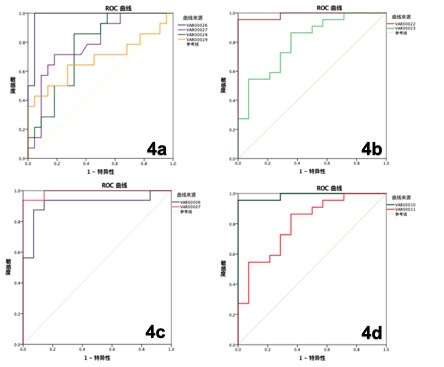
Figure 4. Diagnostic efficiency curve of VHs and mRD(4a), diagnostic efficiency curve of VHs and sRD(4b), diagnostic efficiency curve of the APT values in mRD and sRD(4c) , diagnostic efficiency curve of joint use of the APT values and the R2* value in VHs and mRD (4d).