Jing Chen1, Jinggang Zhang1, Weiqiang Dou2, and Jie Chen1
1The Third Affiliated Hospital of Soochow University, Changzhou, Jiangsu, China, 2GE Healthcare, MR Research China, Beijing, Beijing, China
1The Third Affiliated Hospital of Soochow University, Changzhou, Jiangsu, China, 2GE Healthcare, MR Research China, Beijing, Beijing, China
T2
values of the outer medulla increased at 1 hour after IRI and decreased from 1 hour
to 48 hours gradually. T2 values of the renal outer medulla in the
IRI group showed significant
positive correlation with tubular epithelial edema.
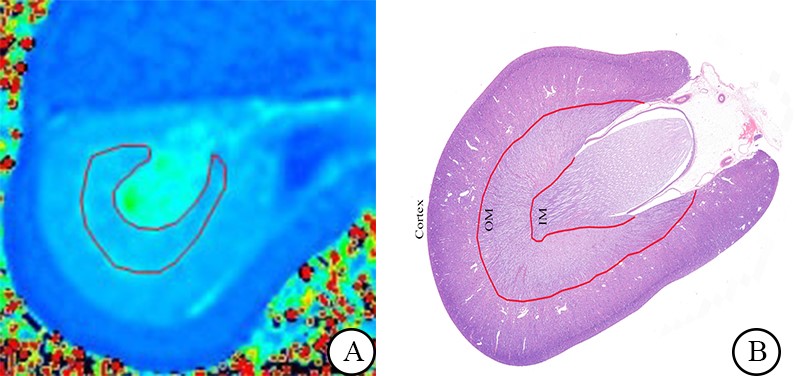
Fig 1. ROIs are drawn on
T2 maps, and manually delineated along the margin of the renal outer medulla
(A). The outer medulla is delineated according to the anatomy on the
pathological map (B). ROI = region of interest. OM = outer medulla. IM = inner medulla.
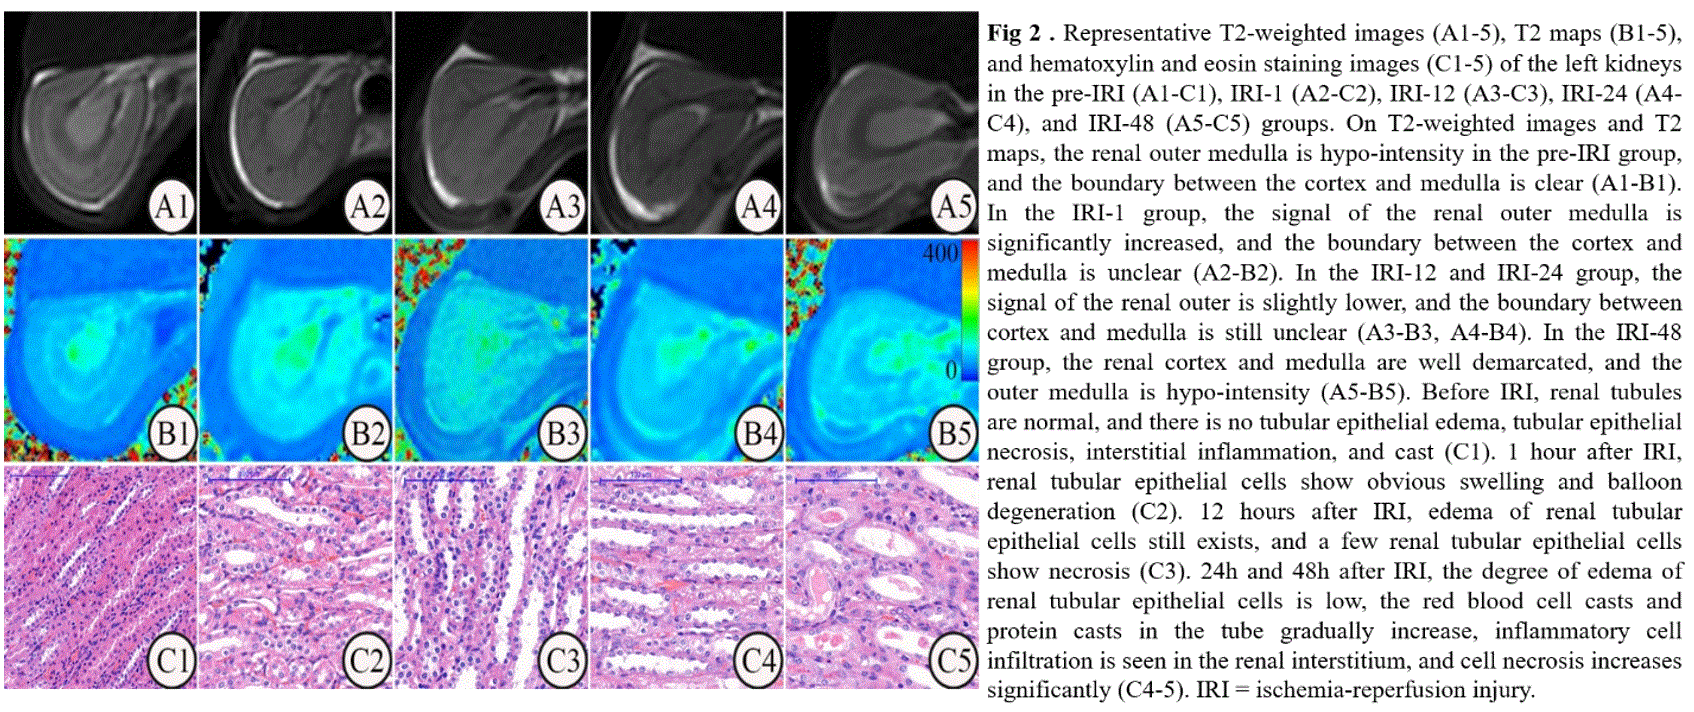
Figure: 2