Byeong-Yeul Lee1, Jeffrey M. Solomon2, Marcelo Castro1, Dong-Yun Kim3, Joseph Laux1, Becky Reeder1, Richard S. Bennett1, Dima Hammoud4,5, and Ji Hyun Lee1
1Integrated Research Facility at Fort Detrick, Integrated Research Facility at Fort Detrick, National Institute of Allergy and Infectious Diseases, National Institutes of Health, Frederick, MD, United States, 2Clinical Monitoring Research Program Directorate, Frederick National Laboratory for Cancer Research sponsored by the National Cancer Institute, Frederick, MD, United States, 3Office of Biostatistics Research, National Heart, Lung and Blood Institute, Bethesda, MD, United States, 4Radiology and Imaging Sciences, Clinical Center, National Institutes of Health, Bethesda, MD, United States, 5Center for Infectious Disease Imaging, National Institutes of Health, Bethesda, MD, United States
1Integrated Research Facility at Fort Detrick, Integrated Research Facility at Fort Detrick, National Institute of Allergy and Infectious Diseases, National Institutes of Health, Frederick, MD, United States, 2Clinical Monitoring Research Program Directorate, Frederick National Laboratory for Cancer Research sponsored by the National Cancer Institute, Frederick, MD, United States, 3Office of Biostatistics Research, National Heart, Lung and Blood Institute, Bethesda, MD, United States, 4Radiology and Imaging Sciences, Clinical Center, National Institutes of Health, Bethesda, MD, United States, 5Center for Infectious Disease Imaging, National Institutes of Health, Bethesda, MD, United States
We performed quantitative neuroimaging of rhesus monkey brains infected with Ebola virus (EBOV) via the intramuscular route. We found observed a significant increase in T1 values in the late stage in prefrontal-basal ganglia-cerebella pathway, suggestive of brain involvement with EBOV.
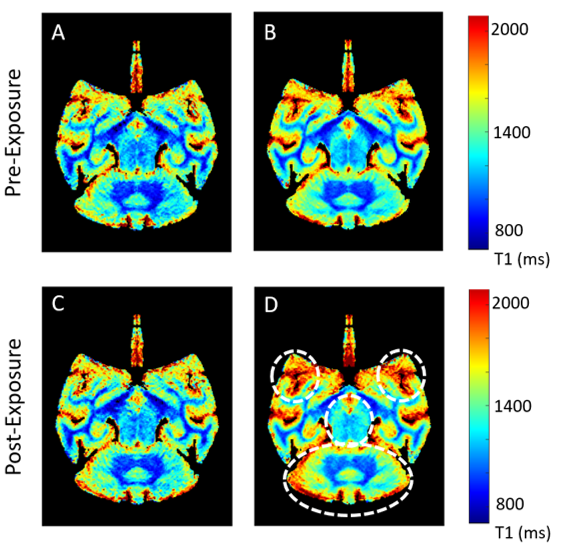
Figure 1. Averaged T1 maps of rhesus
macaque brain in pre- and post-exposure days on DPE 3
(n=3) and DPE 5-7 (n=8), respectively. There were subtle T1 changes between pre-exposure (baseline, A) and early infection
(DPE 3, C). The widespread significant T1 changes were observed
in the late infection stage (DPE 5-7, D) compared to baseline (B) in the multiple
regions, including the cerebellum, prefrontal, and orbital gyrus (white arrow
and dotted circle).
Figure 2. A voxel-based statistical comparison of T1 of rhesus
monkey brains between pre- and post-EBOV exposure. A. There were no significant
changes in T1 values between baseline (pre-infection) and early infection (DPE
3). B. A significant increase in T1 values was found however in the late EBOV infection
stage (DPE 5-7). Statistical significance was considered at corrected p
< 0.005 (one-tailed paired t-test, FDR correction). The colorbar indicates T
scores.