Talaignair N Venkatraman1, Ouyang Chen2, Allen W Song3, Ru-Rong Ji2, and Christopher D Lascola1
1Radiology, Duke University Medical Center, Durham, NC, United States, 2Neurobiology, Duke University Medical Center, Durham, NC, United States, 3BIAC, Duke University Medical Center, Durham, NC, United States
1Radiology, Duke University Medical Center, Durham, NC, United States, 2Neurobiology, Duke University Medical Center, Durham, NC, United States, 3BIAC, Duke University Medical Center, Durham, NC, United States
In a CTCL mouse model of chronic pruritis, we show a statistically significant increase in fiber tract number and other DTI markers of tract integrity through the thalamus and hippocampus.
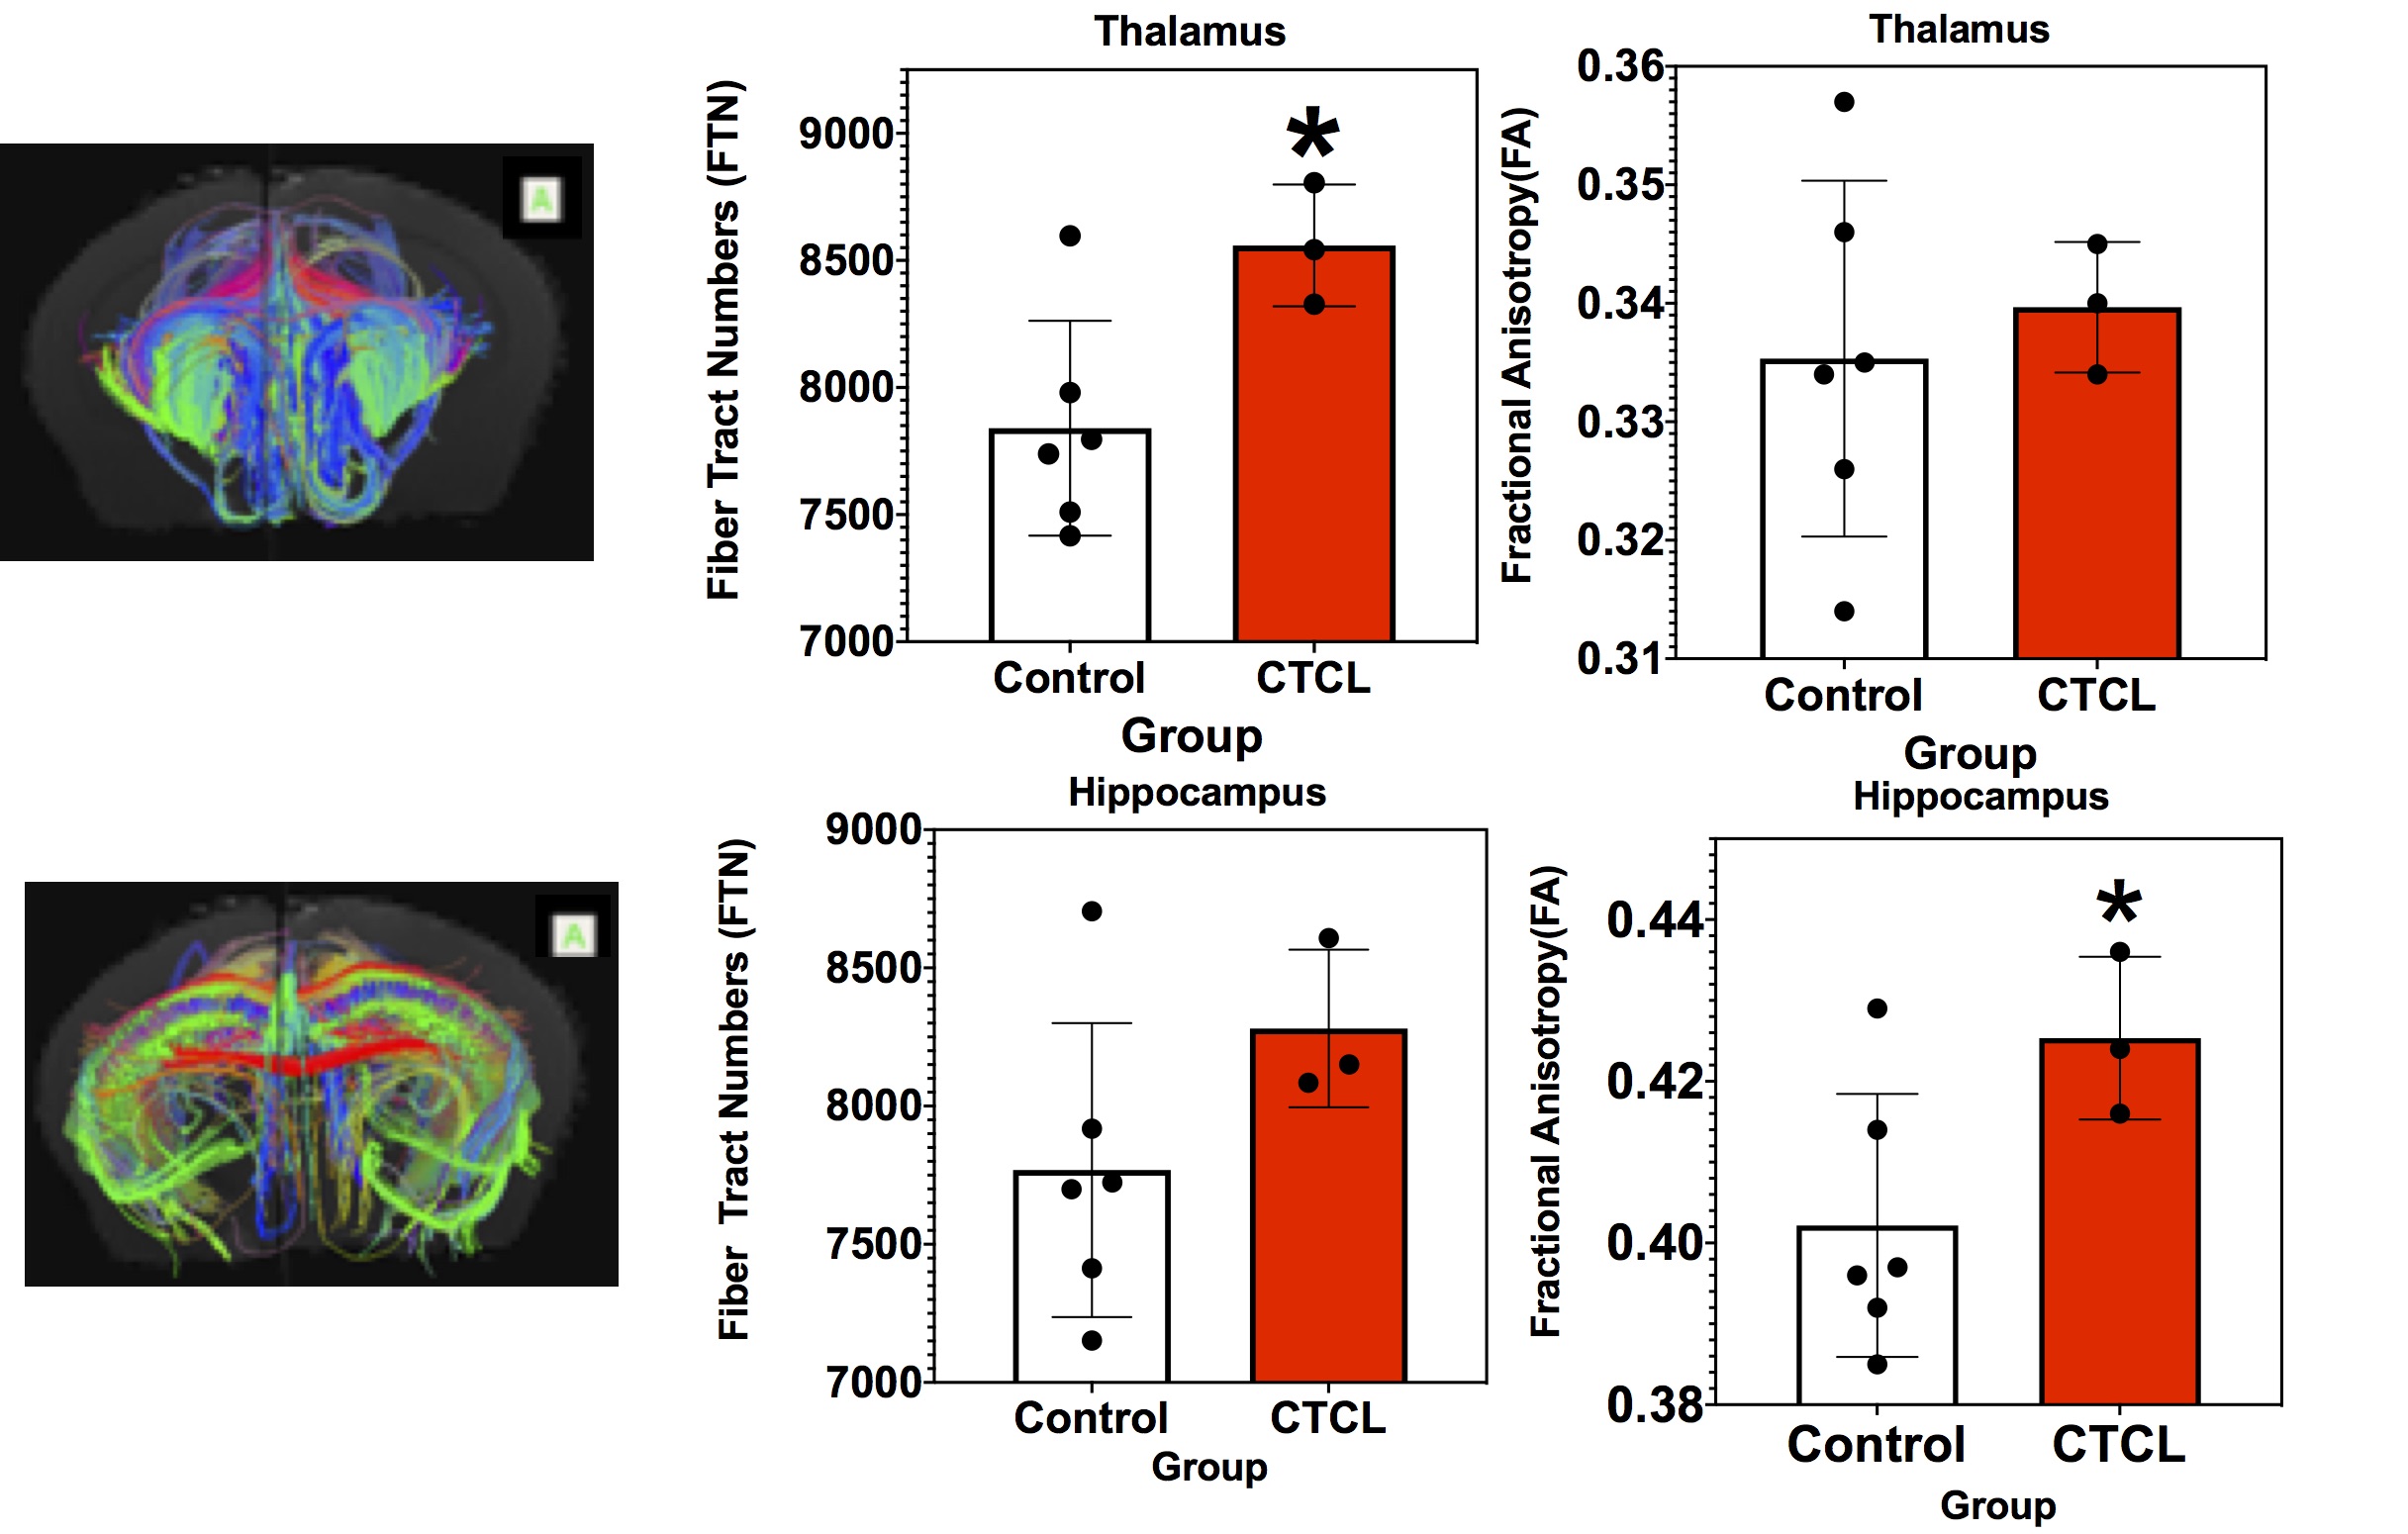
Figure 1: The fiber Tracts pass through Thalamus (Top Row) and Hippocampus (Bottom Row) without parcellation. Fiber Tract Numbers (FTN) and corresponding Fractional Anisotropy (FA) with Control and CTCL groups are also shown. t-test * p0.05.
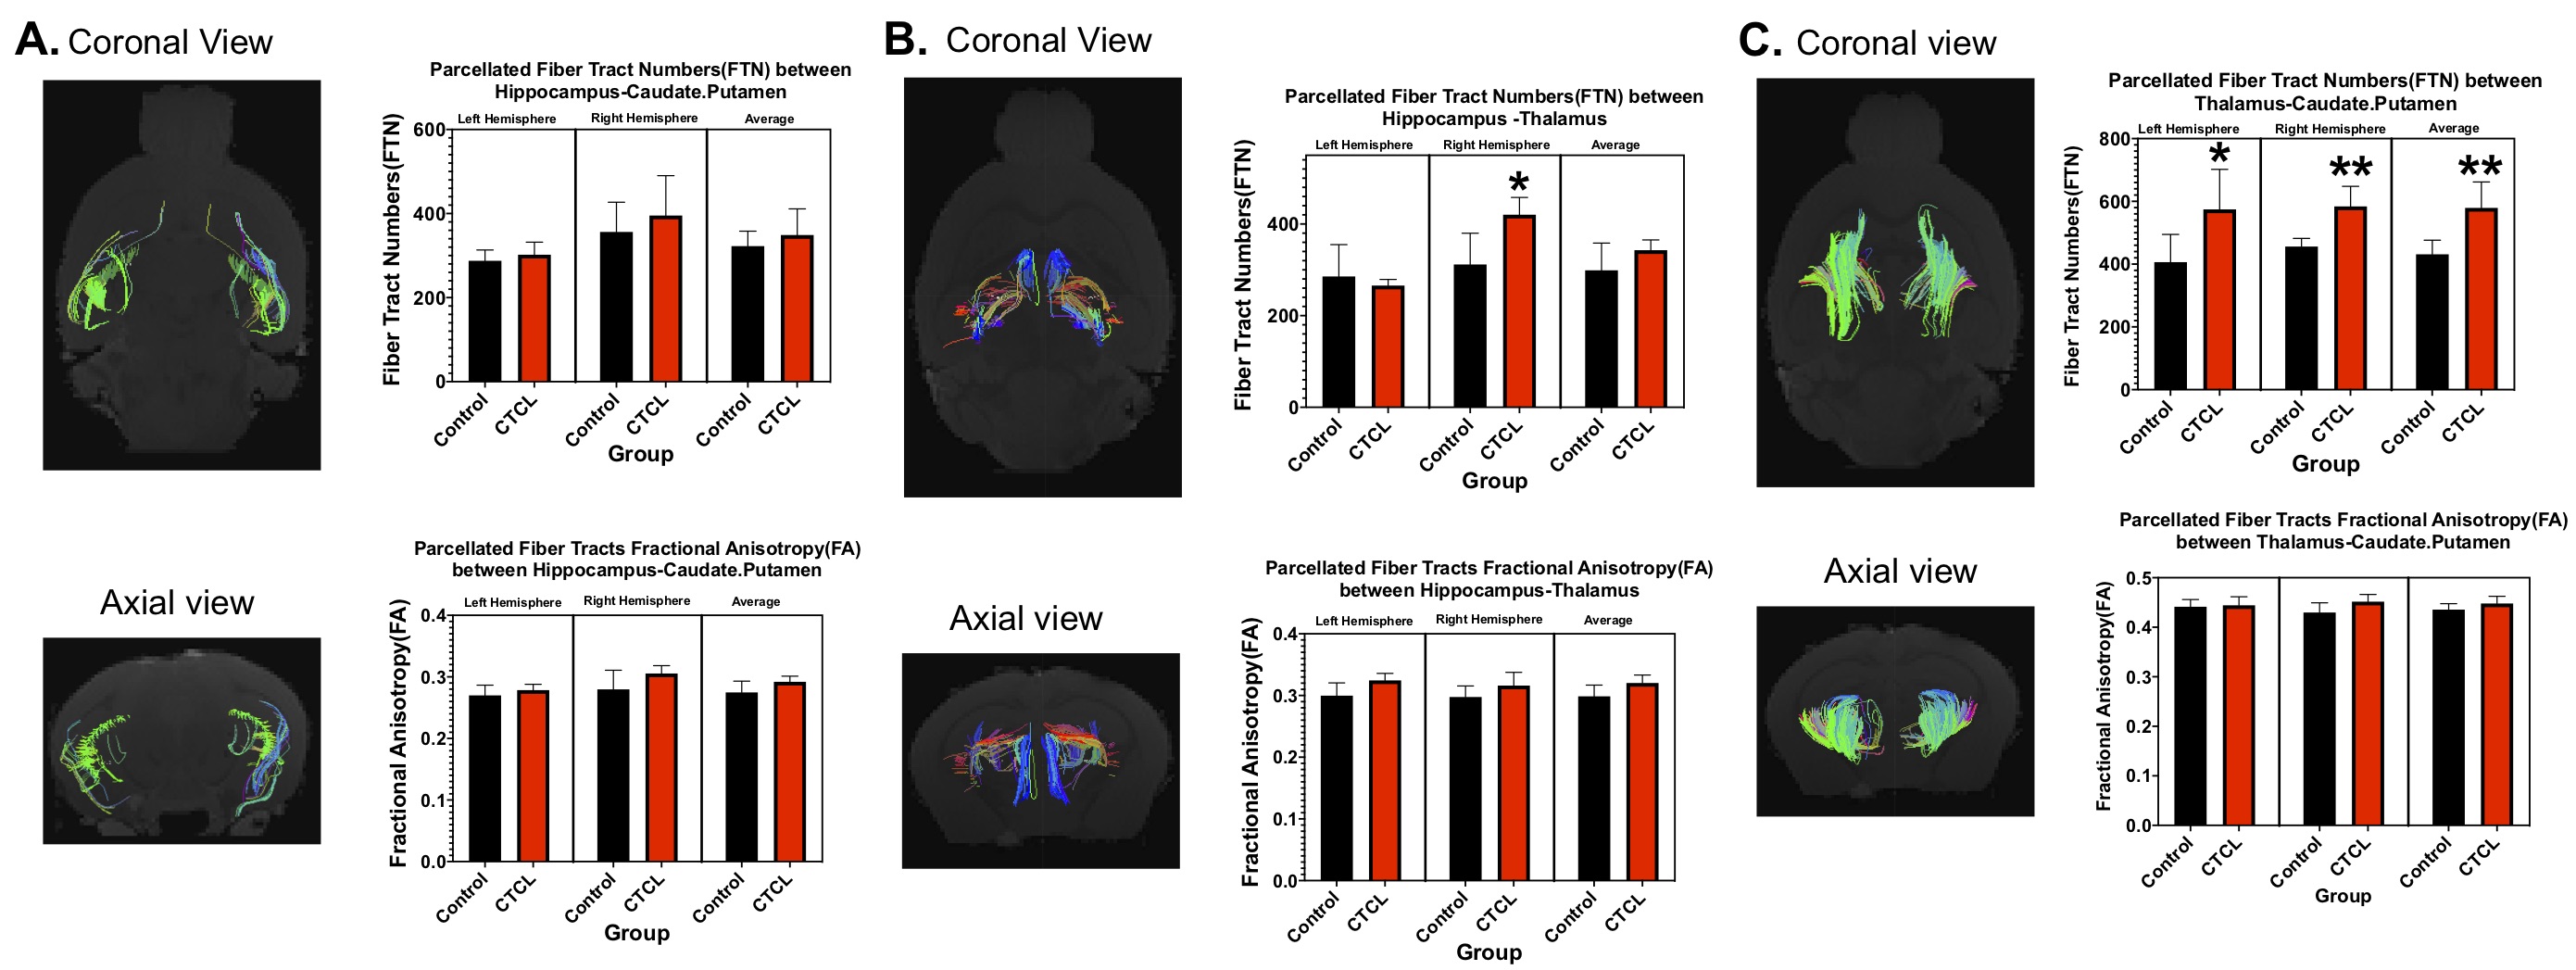
Figure 2: After Parcellation, Fiber Tract Numbers (FTN) and Fractional Anisotropy (FA) for (A) Hippocampus-Caudate.Putamen, (B) Hippocampus-Thalamus and (C) Thalamus-Caudate-Putamen are shown. t-test * p 0.05 and ** p 0.01.