Raphiel Jamale Murden1, Deqiang Qiu2, and Benjamin B Risk2
1Biostatistics and Bioinformatics, Emory University, Atlanta, GA, United States, 2Emory University, Atlanta, GA, United States
1Biostatistics and Bioinformatics, Emory University, Atlanta, GA, United States, 2Emory University, Atlanta, GA, United States
Canonical Joint and Individual Variation Explained incoroporates a step to impute missing data and uses a computationally efficient permutation test to estimate the joint rank. Patterns of variation shared between measures of brain atrophy and cognition areassociated with diagnoses.
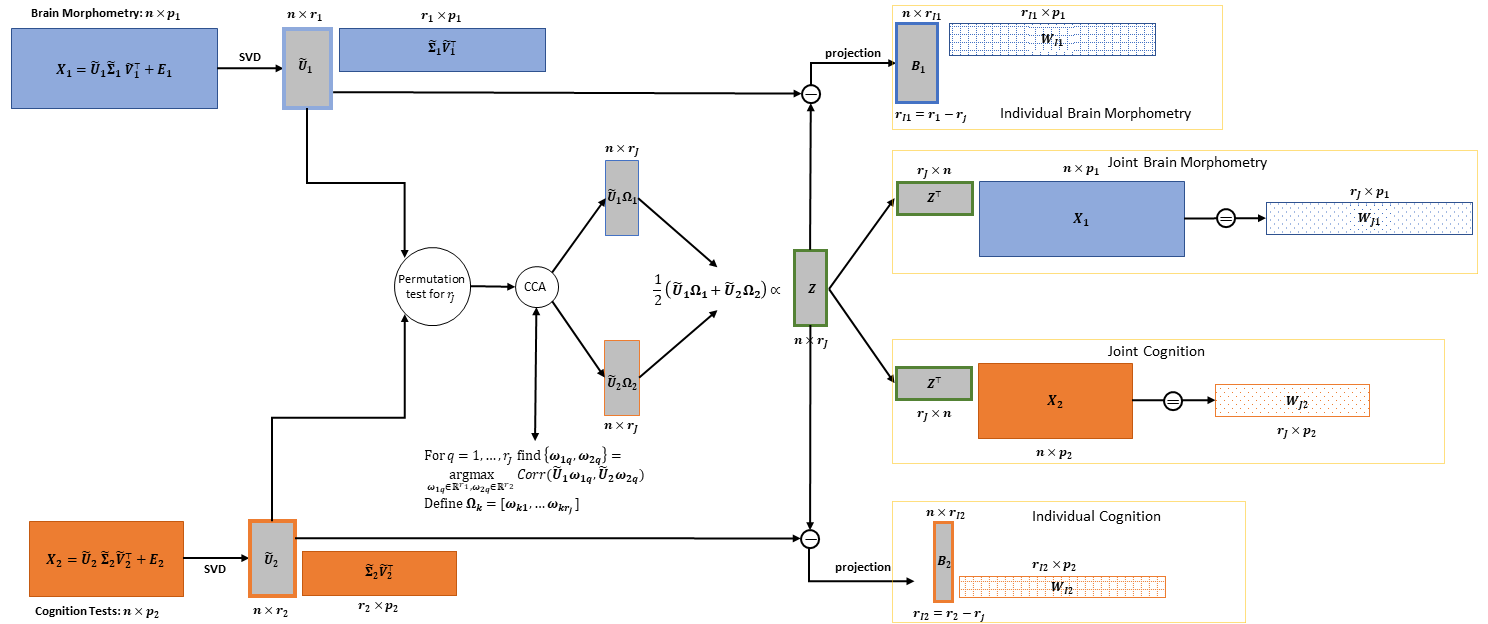
Schematic of the CJIVE process. Singular value decomposition (SVD) is applied to the input data matrices (far left) to obtain dimension-reduced PC scores. Next, a permutation test is used to determine the number of components that will lie in the joint subspace. CCA is applied to the PC scores and a weighted average of canonical variables determines the joint subspace. Finally, individual subspaces can be determined by the orthogonal complement of the joint subspace within the respective PC subspaces.
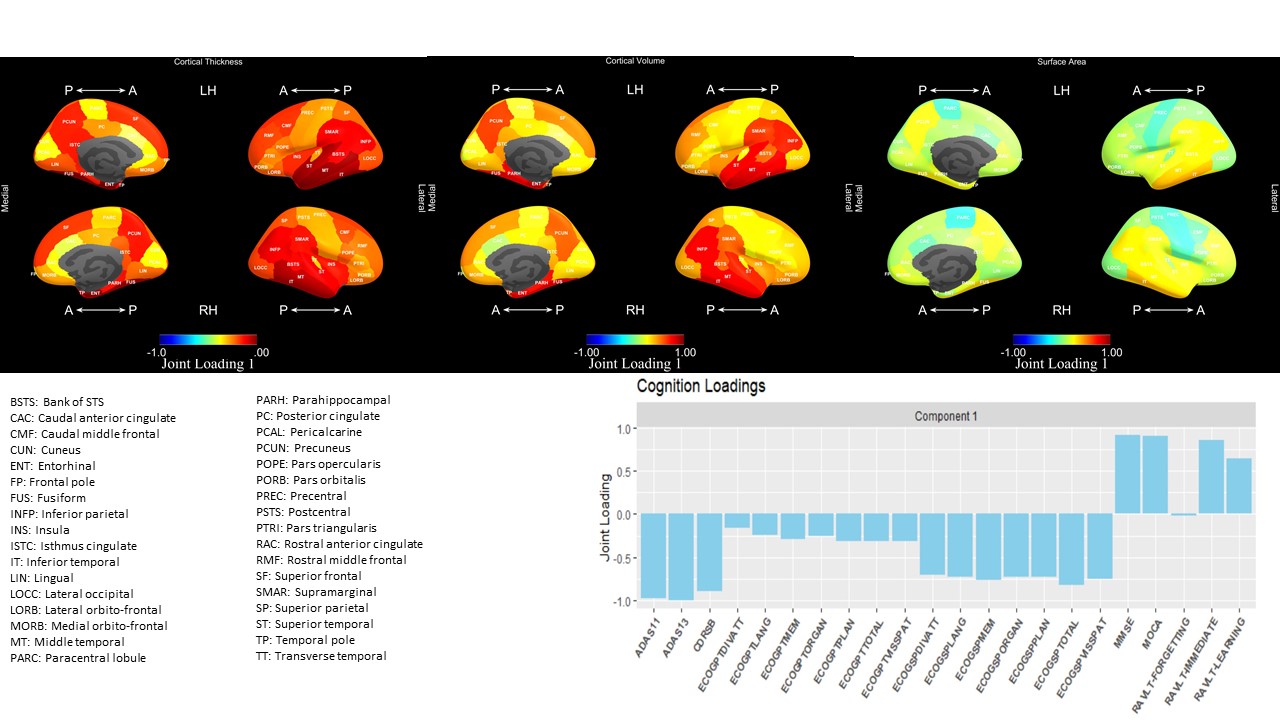
Joint Loadings for component 1. Temporal lobe ROI measures were most prominent among morphometry loadings, including both thickness and volume. ADAS and MMSE dominated cognition loadings (bottom) and both have been shown as excellent diagnostic tools. The proportions of total variation explained by the first joint component were 0.147 for morphometry and 0.467 for cognition. Proportions explained by the second component (not shown) were 0.025 and 0.044 for morphometry and cognition, respectively.