Yiyun Dong1, Qing-San Xiang2,3, and Michael Nicholas Hoff4
1Physics, University of Washington, Seattle, WA, United States, 2Physics, University of British Columbia, Vancouver, BC, Canada, 3Radiology, University of British Columbia, Vancouver, BC, Canada, 4Radiology, University of Washington, Seattle, WA, United States
1Physics, University of Washington, Seattle, WA, United States, 2Physics, University of British Columbia, Vancouver, BC, Canada, 3Radiology, University of British Columbia, Vancouver, BC, Canada, 4Radiology, University of Washington, Seattle, WA, United States
The first analytical solution to relaxation parameter T2 mapping based on the bSSFP elliptical formulation is proposed. It is robust to variation in other imaging parameters, and gives rise to exact T2 quantification to complement artifact-free bSSFP.
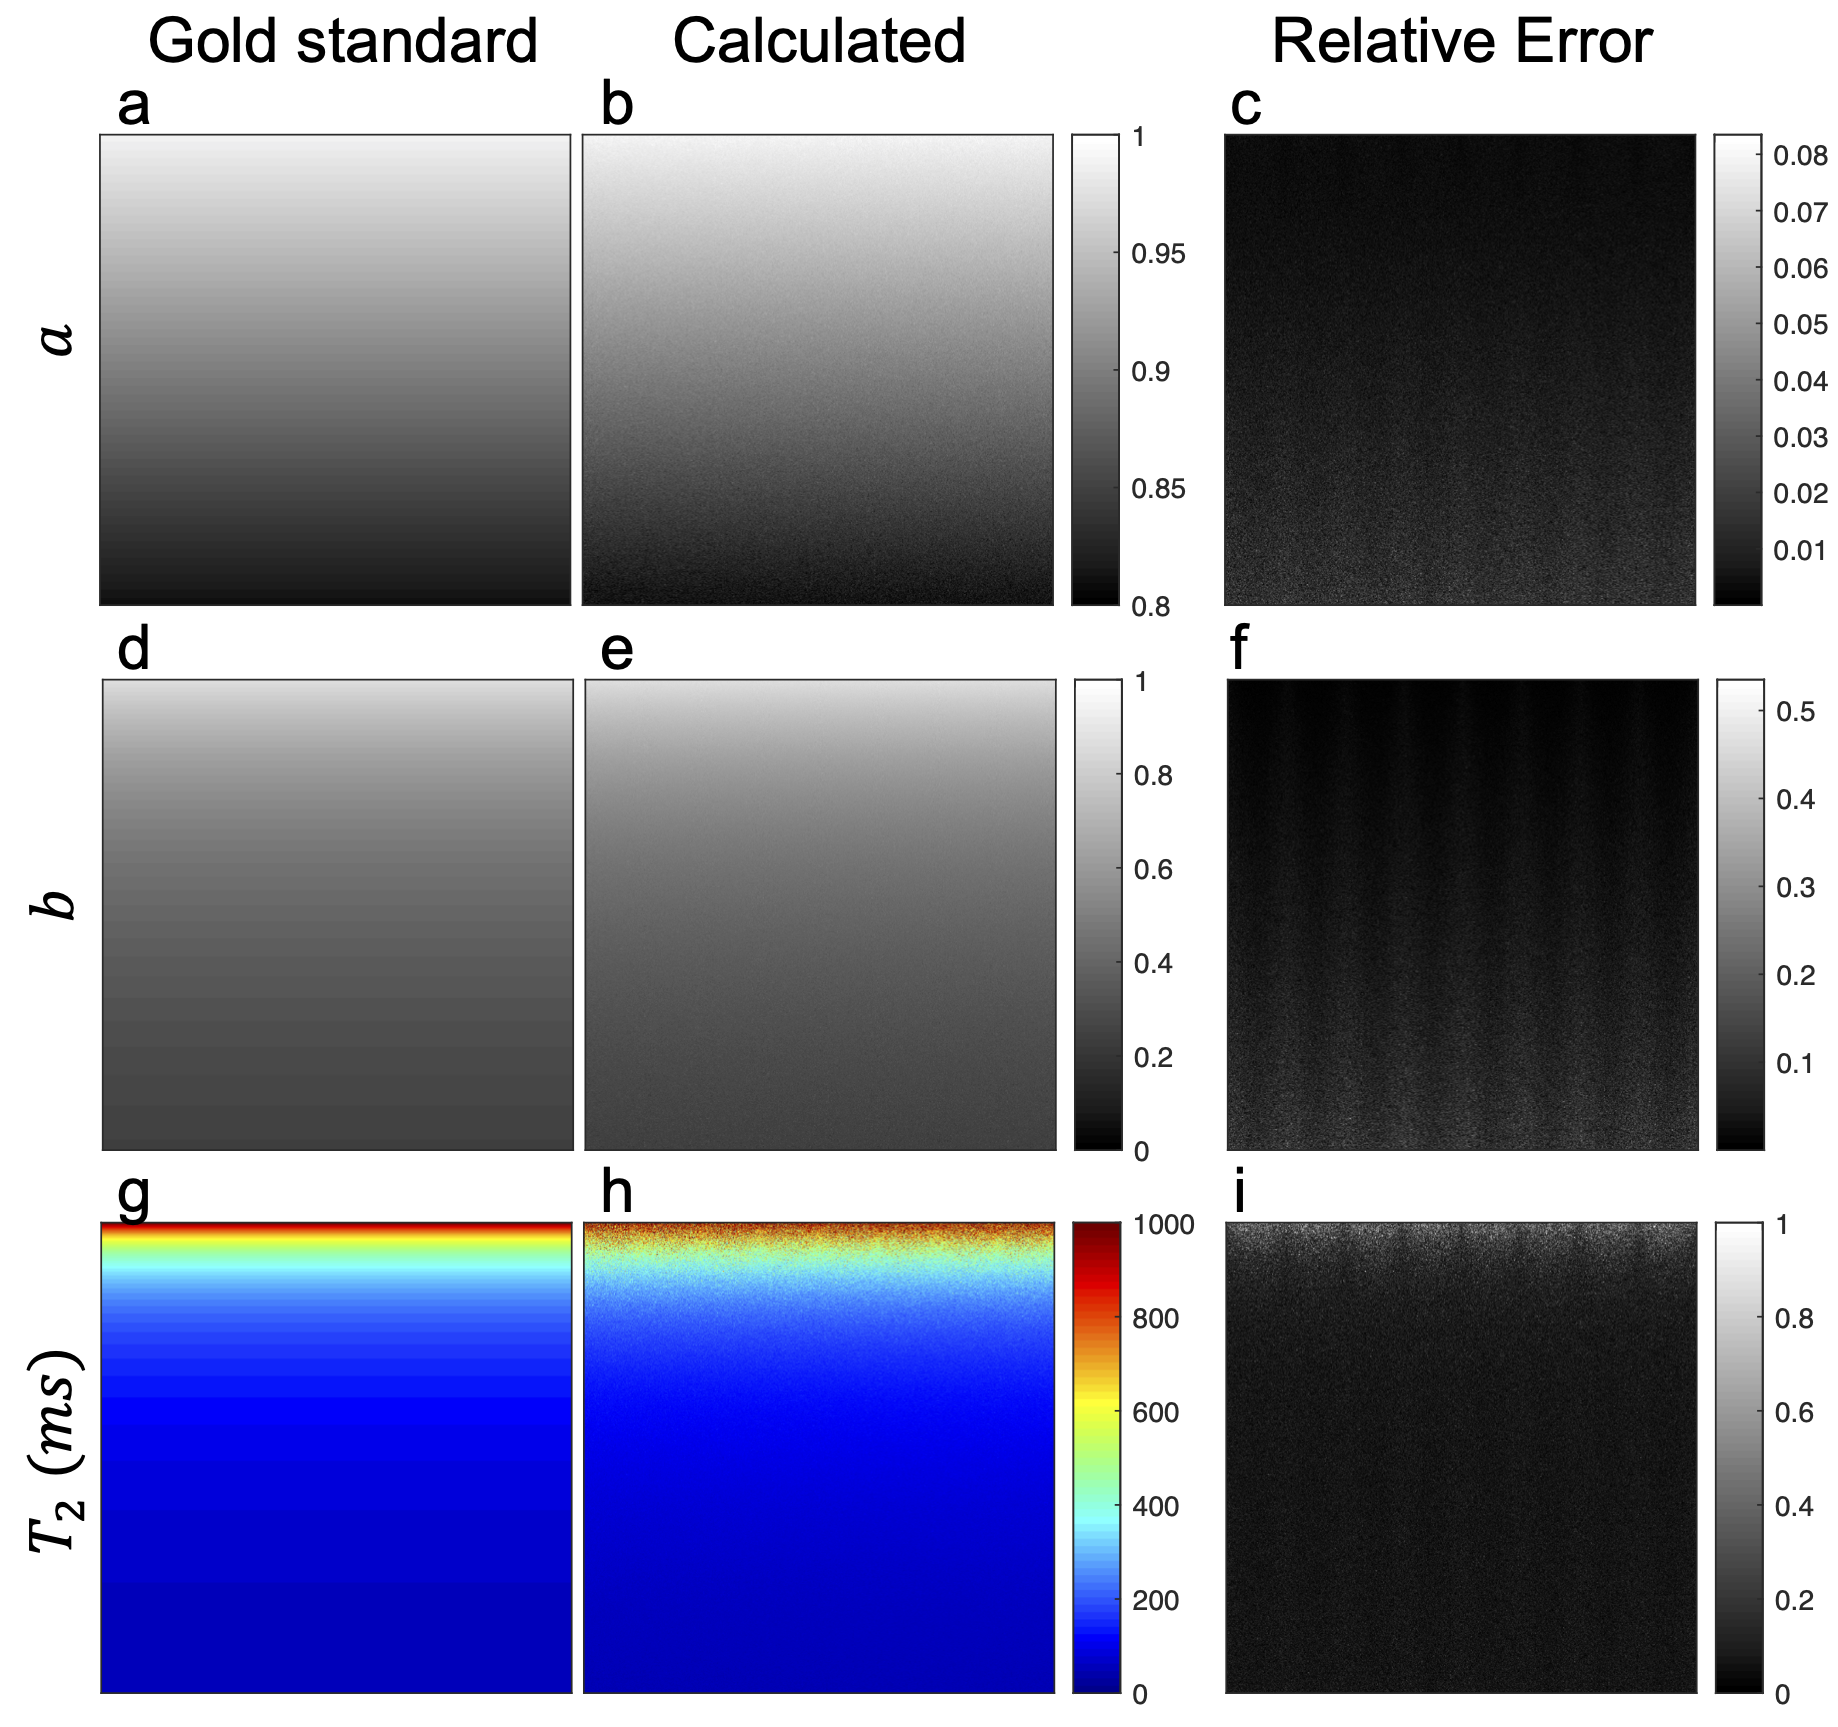
Figure 3: ESM parameter $$$a,b$$$ maps and relaxation parameter $$$T_2$$$ maps. Gold standard, calculated and relative error for $$$a$$$ solution (a-c), $$$b$$$ solution (d-f), and $$$T_2$$$ (g-i) depicted in columns from left to right respectively. Color is applied for better visibility of different $$$T_2$$$ values.
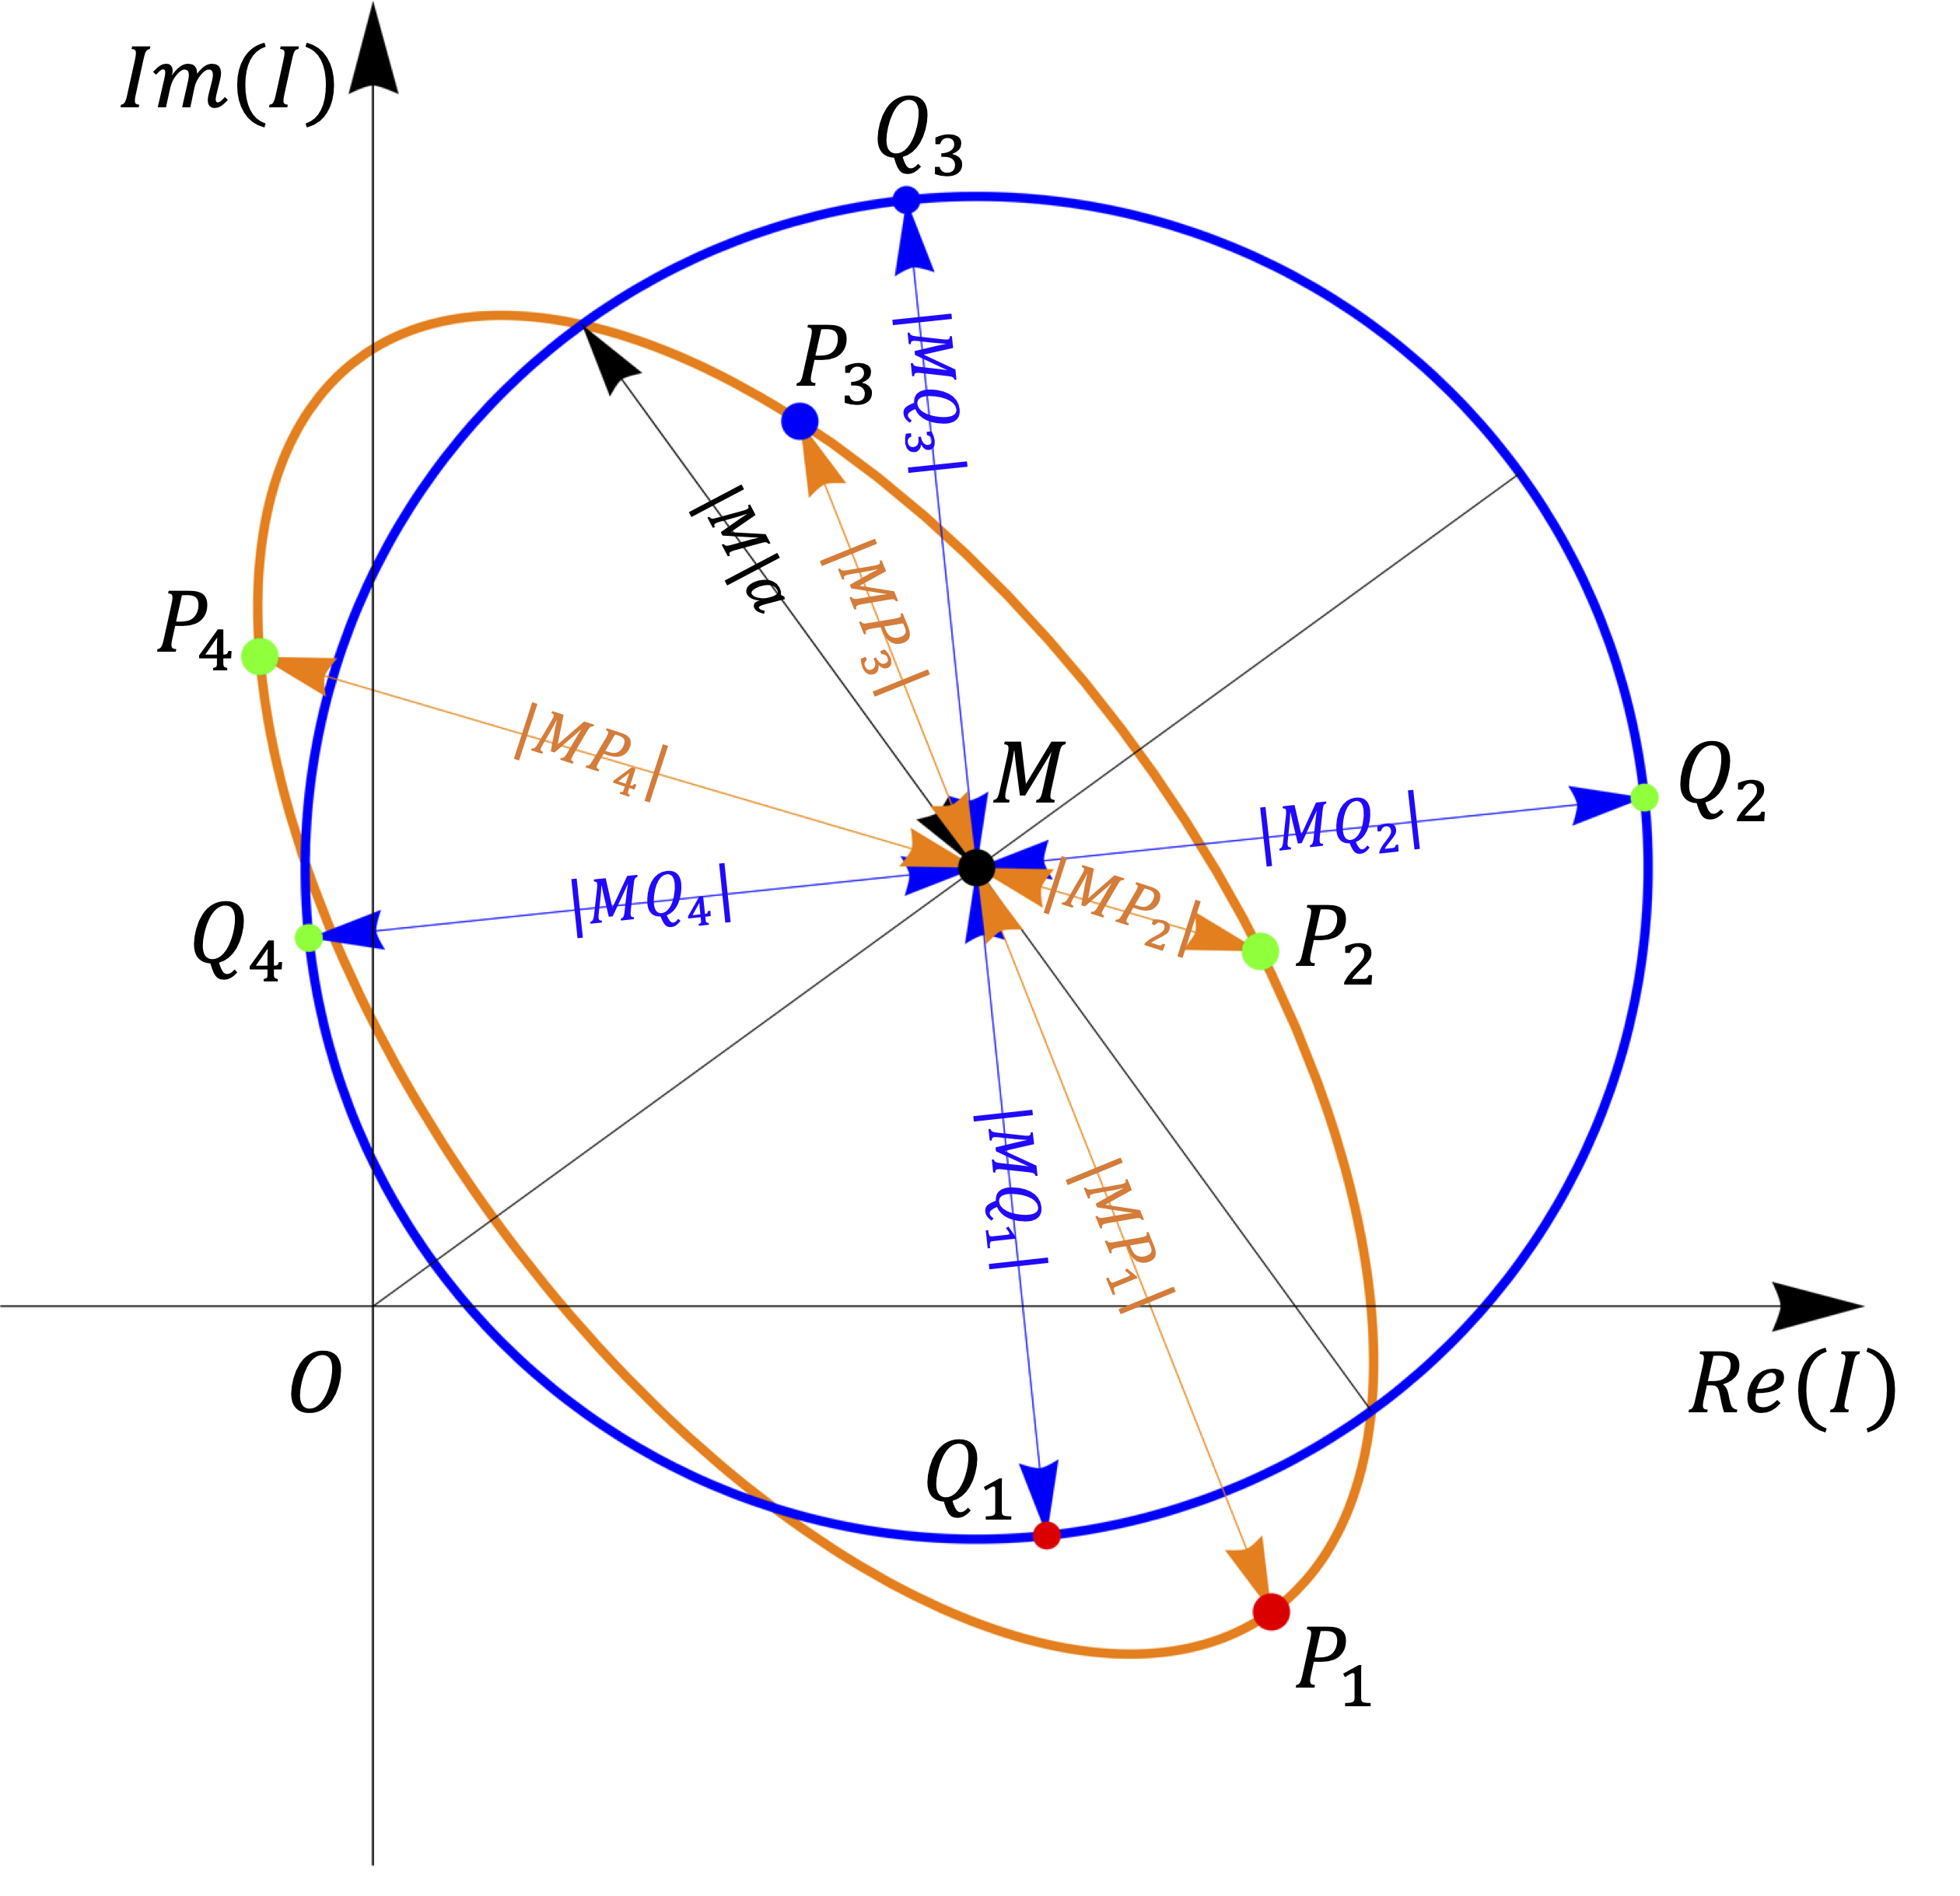
Figure 1: A example of the signal ellipse. The orange curve represents the signal ellipse. The blue curve represents the transformation of the signal ellipse $$$I_i$$$ with points $$$P_i$$$ to a circle with points $$$Q_i$$$. The blue curve center is indicated by the geometric cross-point $$$M$$$, and its radius by $$$|M|a=|MQ_i|$$$.
