Wenchao Yang1, Burak Akin1, Xiang Gao1, Benedikt Poser2, and Jürgen Hennig1
1Department of Radiology, Medical Physics, Faculty of Medicine, Medical Center - University of Freiburg, Freiburg, Germany, 2Maastricht Brain Imaging Centre, Faculty of Psychology and Neuroscience, Maastricht University, Maastricht, Netherlands
1Department of Radiology, Medical Physics, Faculty of Medicine, Medical Center - University of Freiburg, Freiburg, Germany, 2Maastricht Brain Imaging Centre, Faculty of Psychology and Neuroscience, Maastricht University, Maastricht, Netherlands
We introduced a BOLD Index to figure out the true BOLD response and false positive/non-BOLD signal in task fMRI. This index also shows detailed
cortex active patterns on gray matter rather than t-test the high value are on CSF or vein in fissure or sulci.
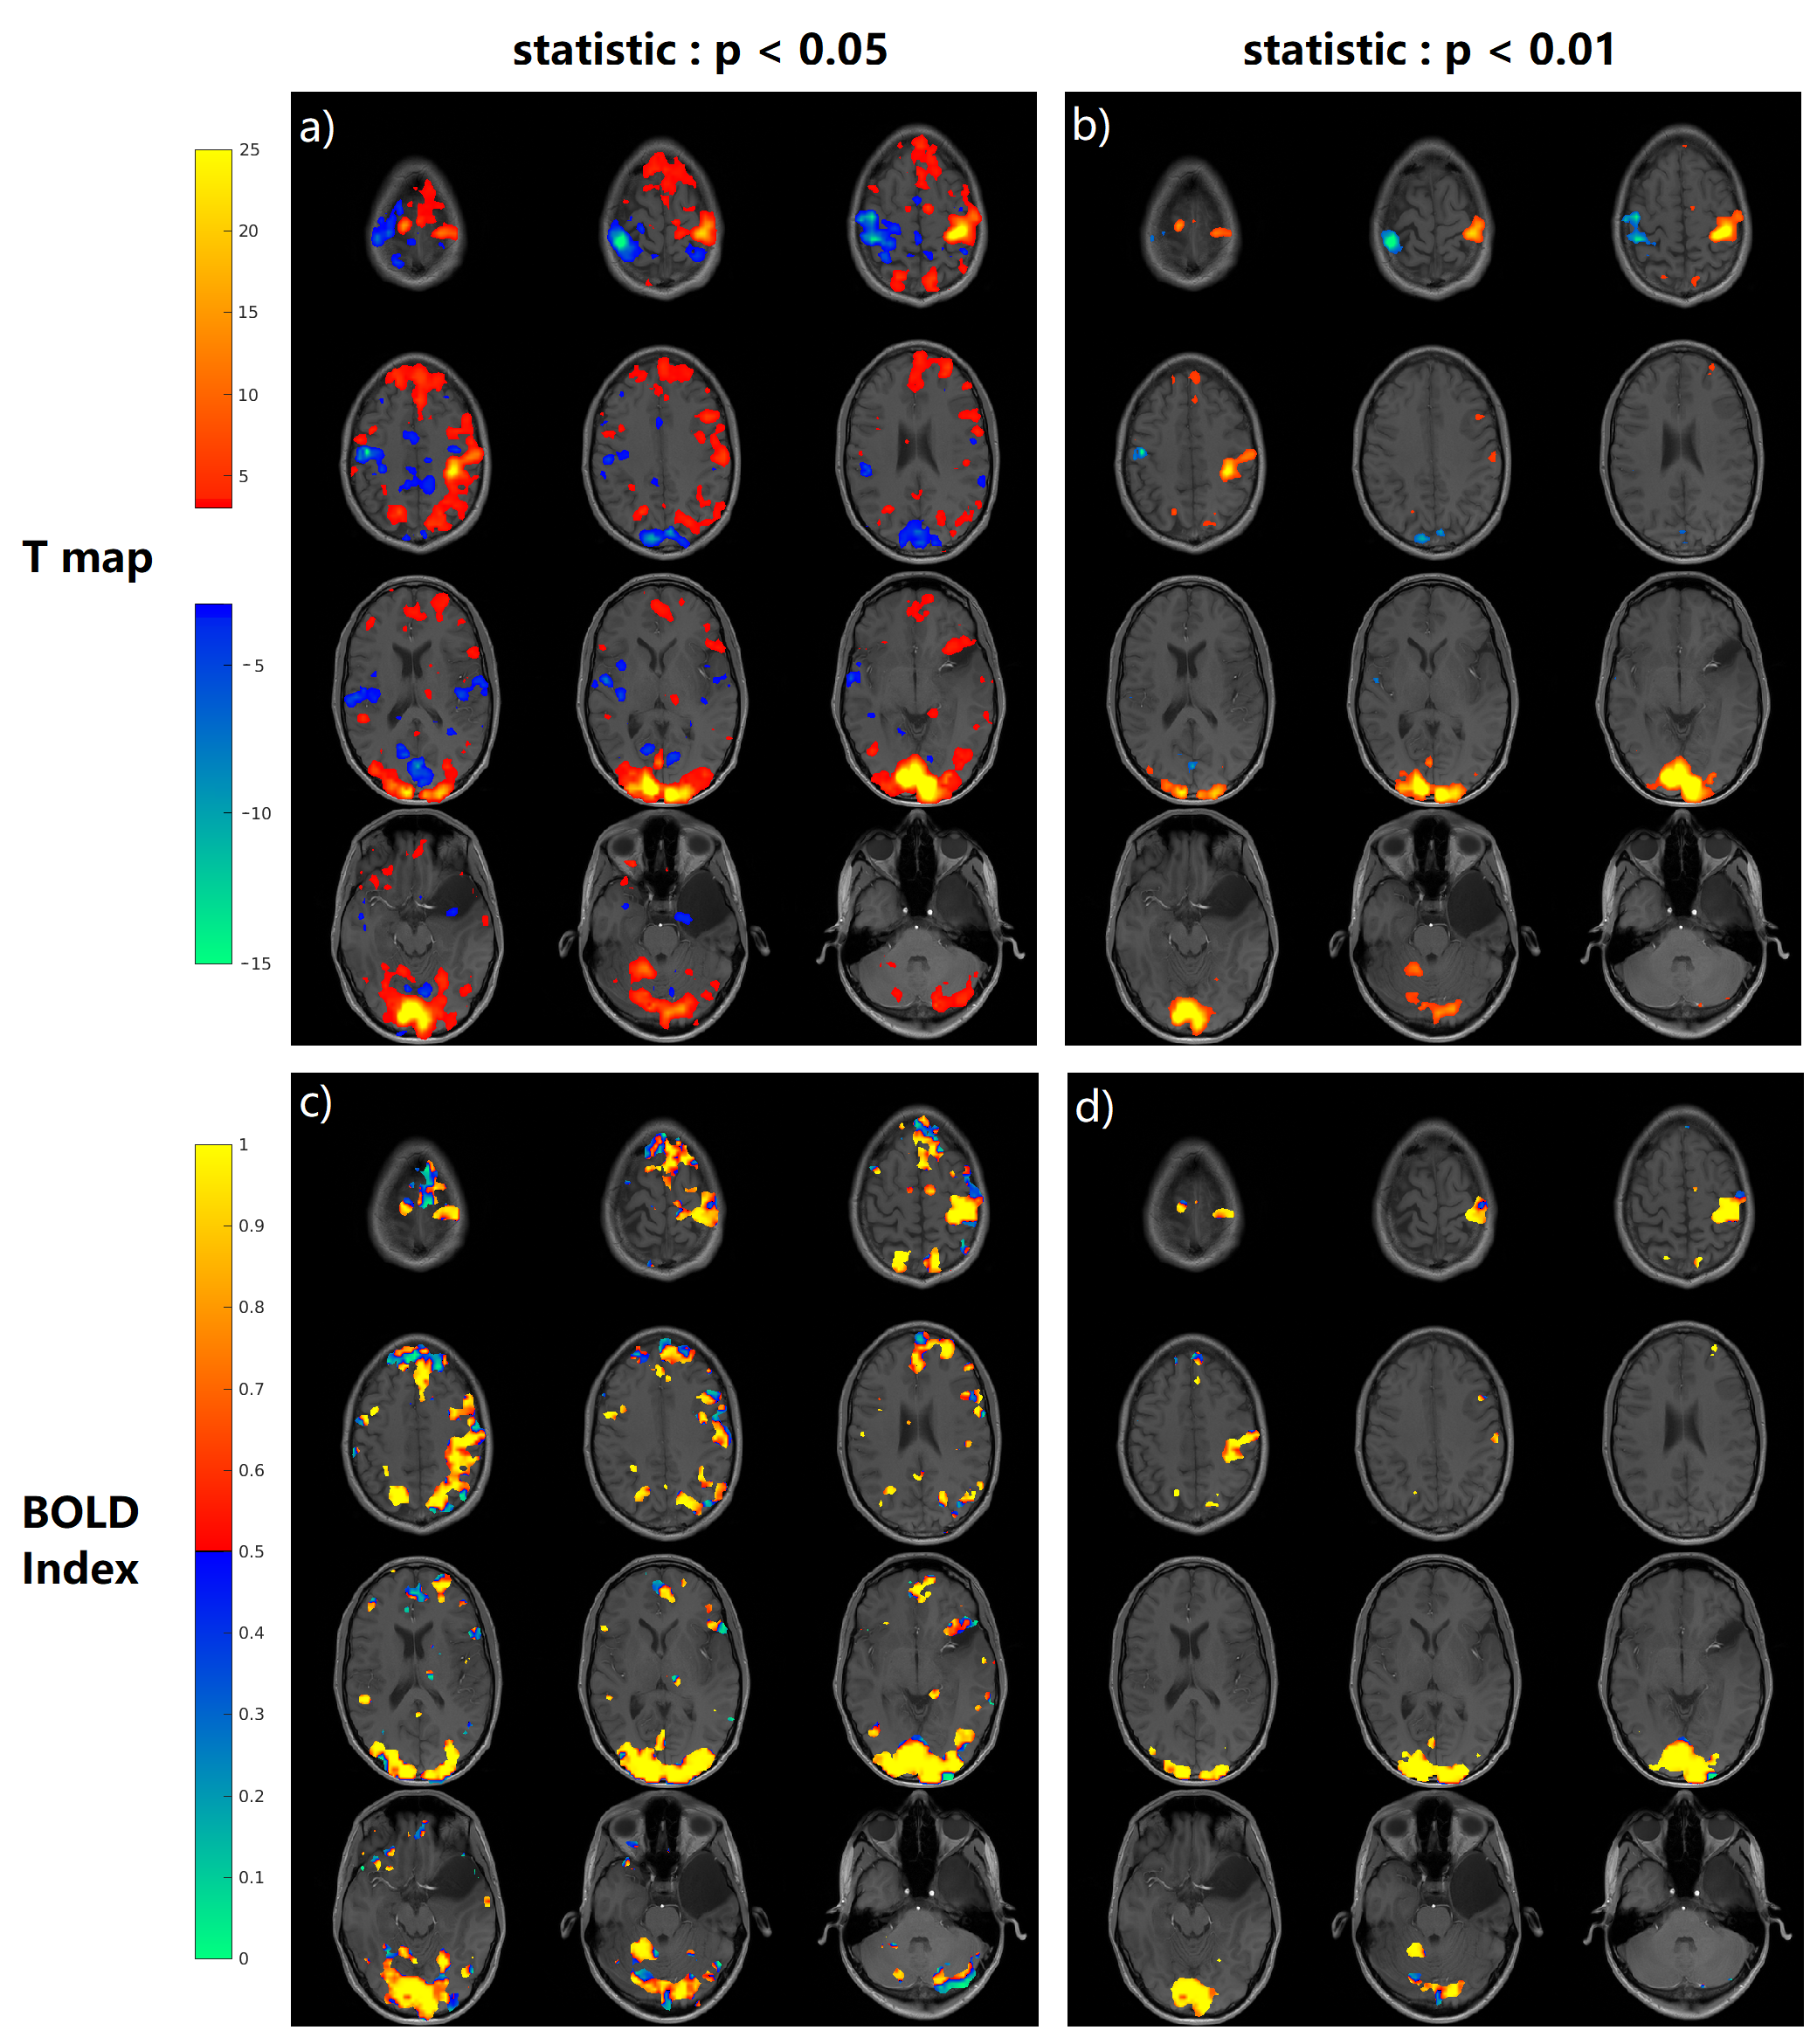
Fig.
4, The T map and BOLD Index mapping under the threshold of p=0.05
and p=0.01. In order to simplify the display, for the BOLD Index, only the
positive activation regions are displayed. The parameter K in BOLD Index equals 1. If
the BOLD Index is bigger than 0.5 which means the voxel is a BOLD signal, and if the BOLD Index is smaller than 0.5 which means the voxel is a non-BOLD signal/false positive. So the blue color in c),d) labels non-BOLD/false positive
regions. There are more blue regions in c) under p<0.05 than in d) under p<0.01.
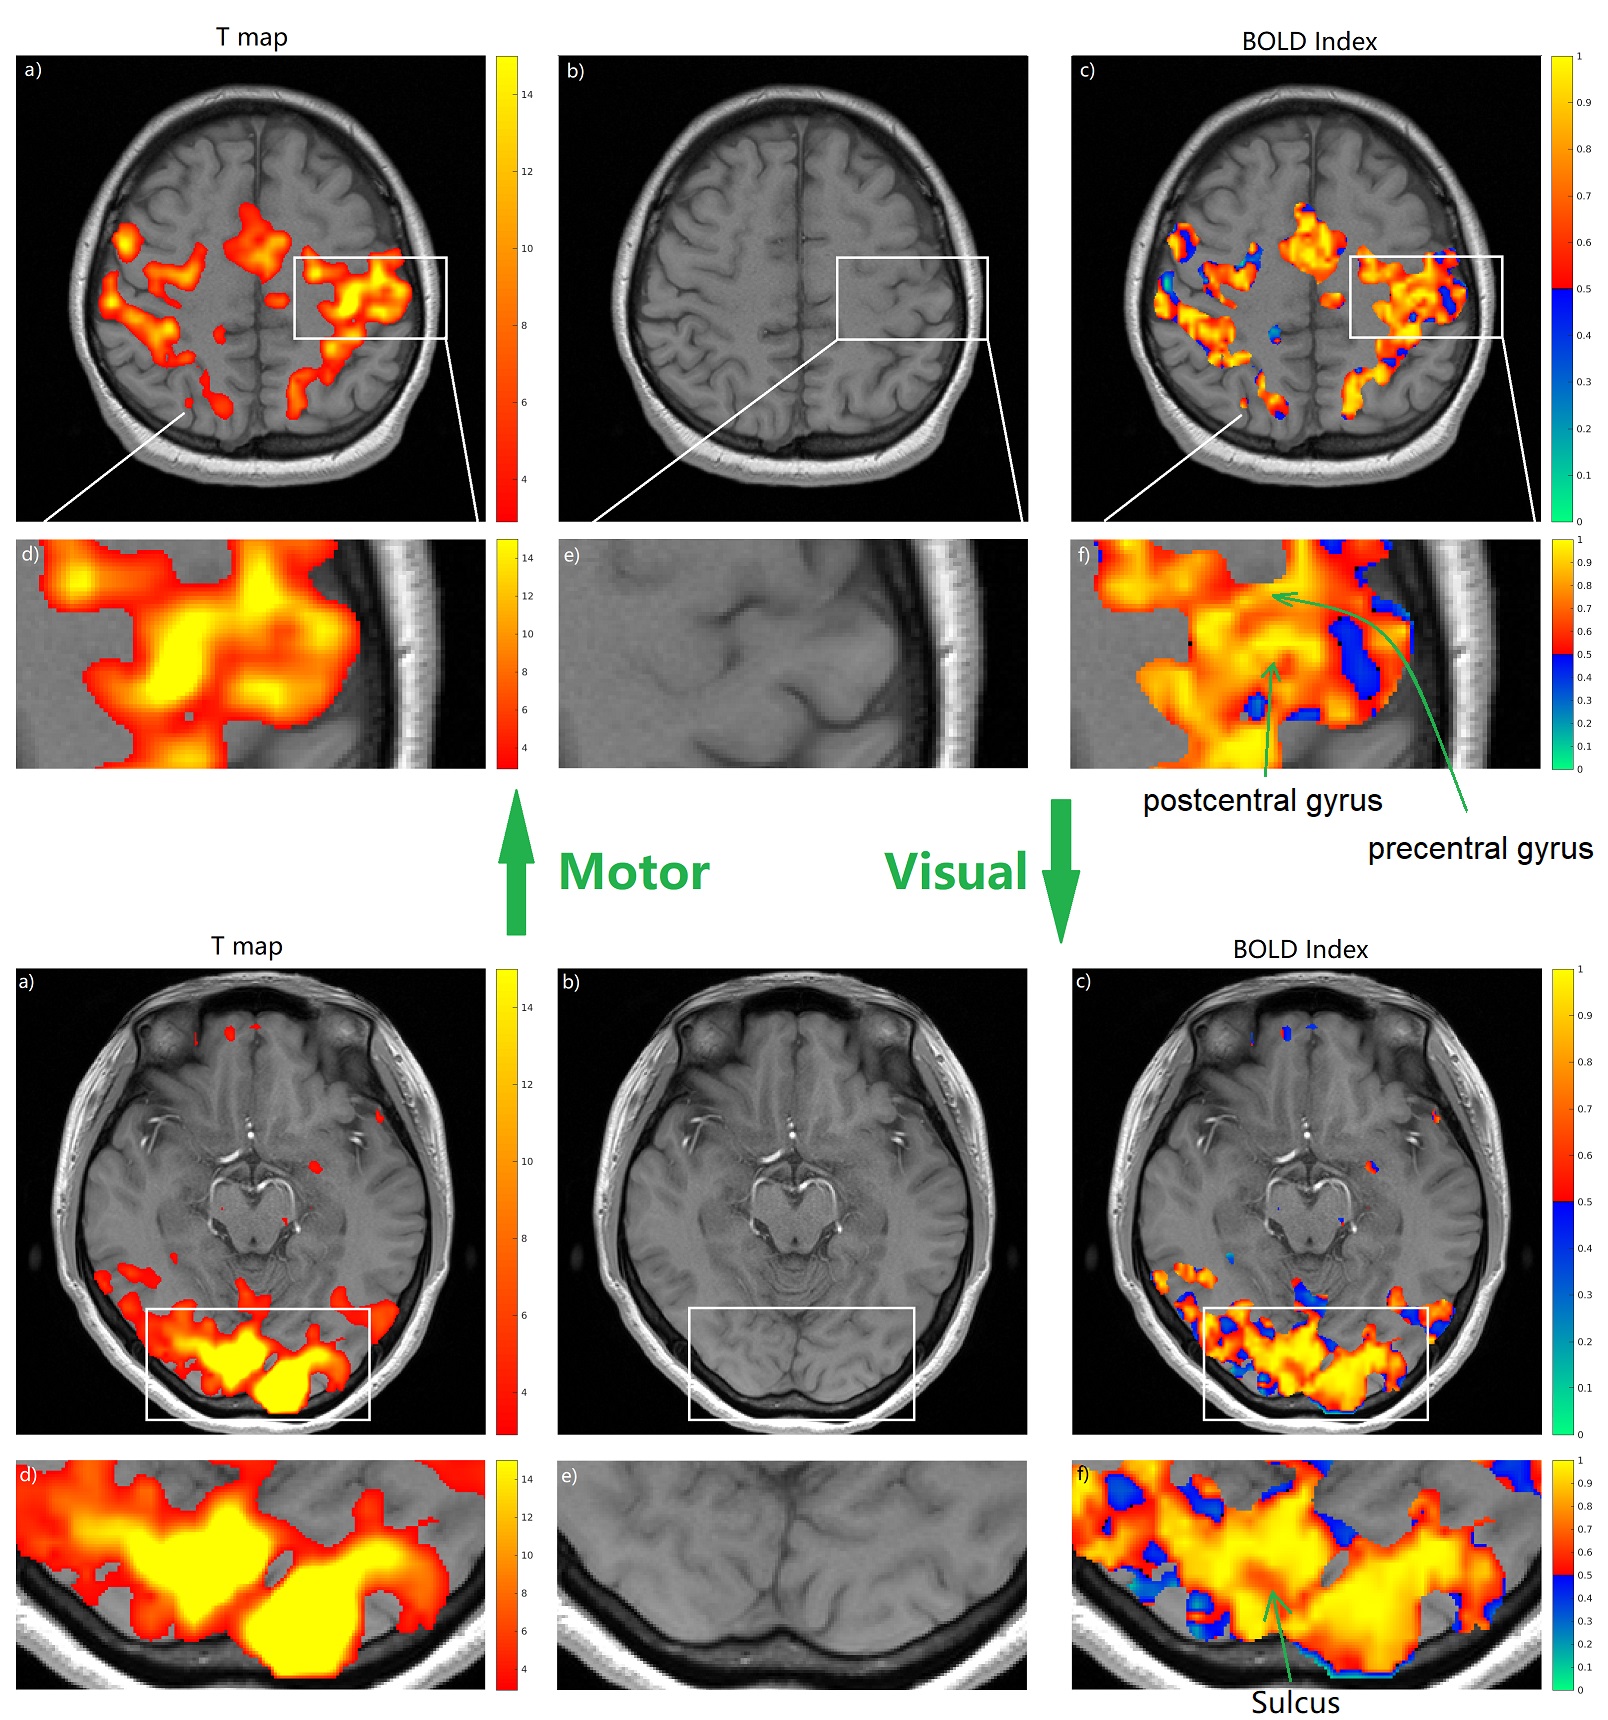
Fig.
5, The T map from standard analysis and BOLD index in smaller voxel size 2*2*3mm3.
The upper part shows the results of the motor cortex and the lower part shows the
results of the visual cortex. a) shows the T map under the threshold of p=0.05; b)
provides the anatomical structure to show where the activation is; c) displays the BOLD index inside the mask from the T map. d), e) and f) are the magnified interest region from a), b) and c) respectively. The parameter K=4 is selected for BOLD Index
to display the detailed activation patterns.