Amirreza Sedaghat1, Farnia Feiz2, Sreyansh Biswall2, Sindy Ozoria2, and Qolamreza R Razlighi2
1Biomedical Engineering, Columbia University, New York, NY, United States, 2Radiology, Weill Cornell Medicine, New York, NY, United States
1Biomedical Engineering, Columbia University, New York, NY, United States, 2Radiology, Weill Cornell Medicine, New York, NY, United States
The magnitude of task-evoked negative BOLD response in the Default mode network linearly changes with an increase/decrease in the duration of the task. These findings validate the use of general linear modeling for analyzing task-evoked negative BOLD response.
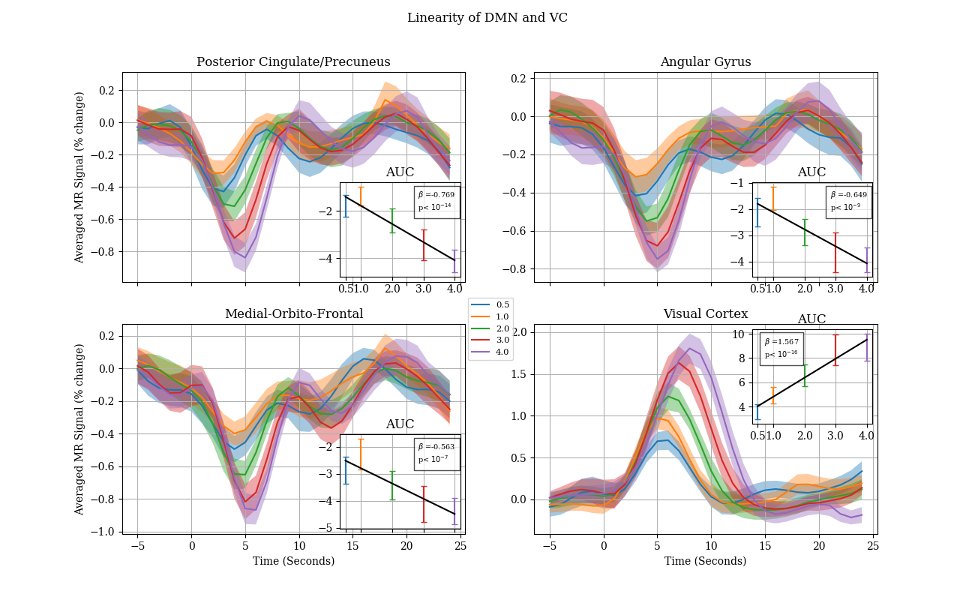
Figure 3. The mean fMRI timeseries from 5 seconds prior and 25 post stimuli period plotted separately for each stimuli duration (0.5 second stimuli in blue, 1 second stimuli in orange, 2 seconds stimuli in green, 3 seconds stimuli in red and 4 seconds stimuli in purple). As expected, the visual cortex shows a perfectly linear response in respect to the length of the stimulus. Similar linearity patterns are shown within DMN regions except with 0.5 and 1 second stimuli.
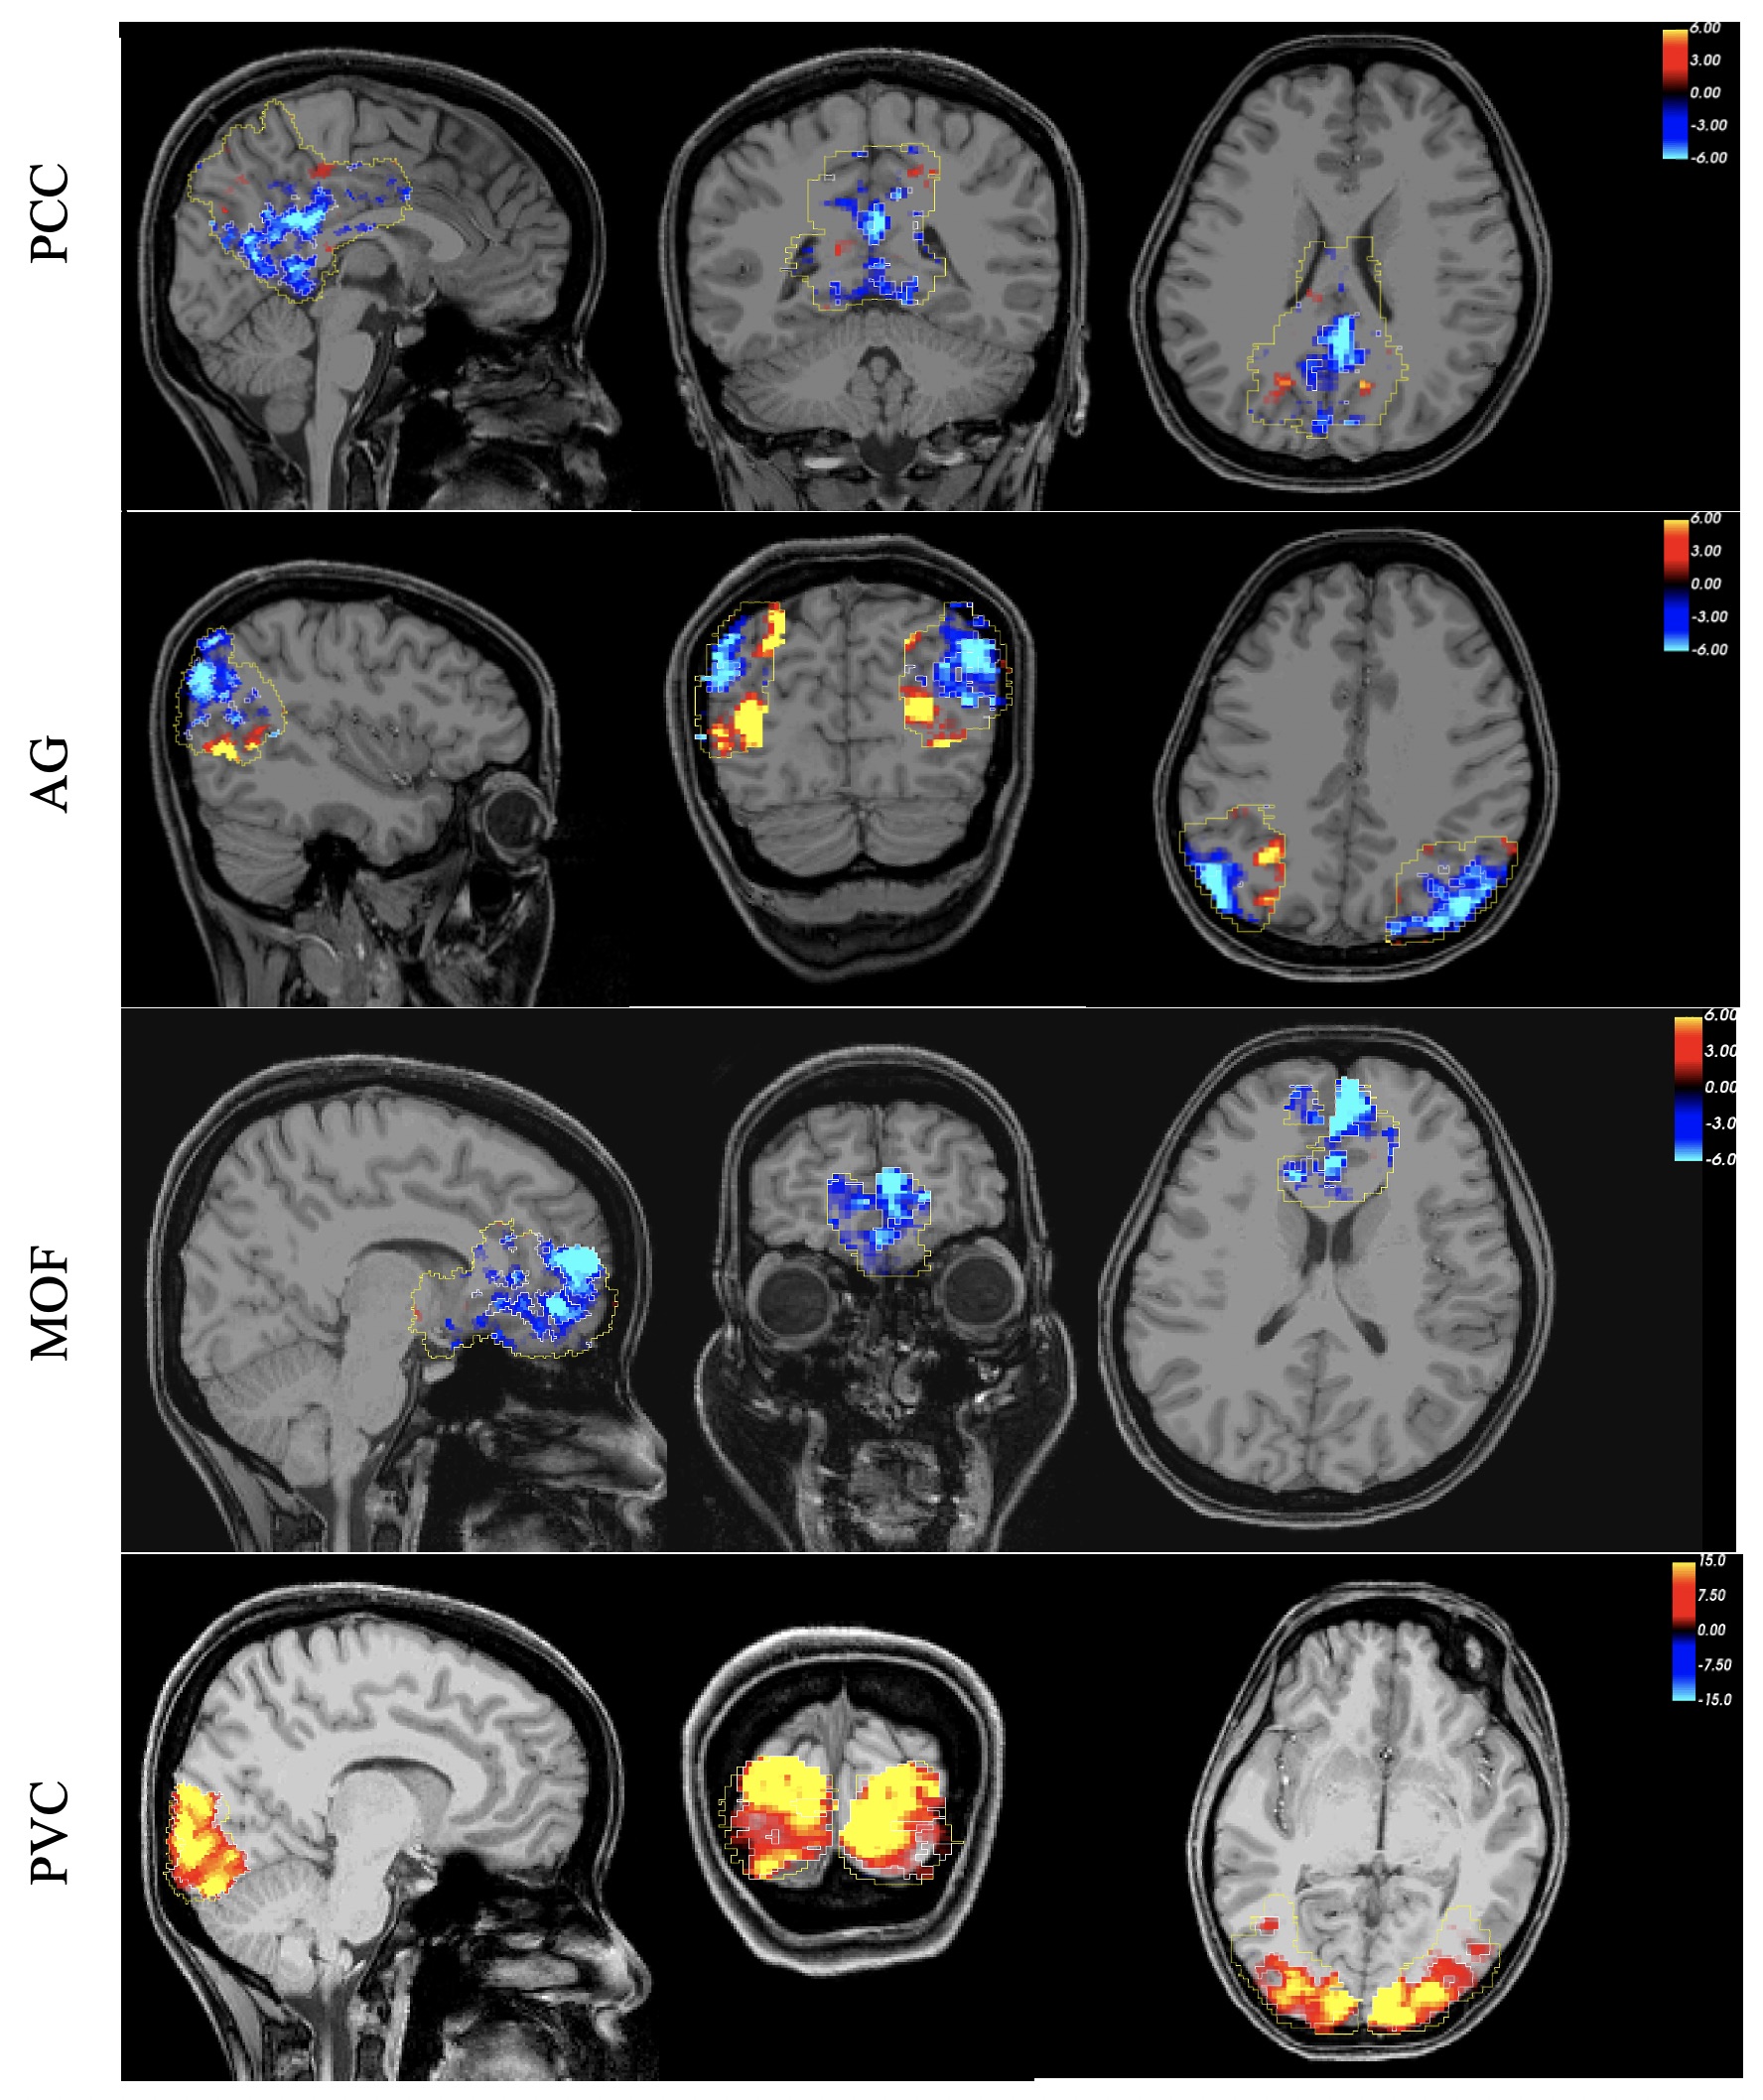
Figure 2, Spatial pattern of the responsive voxels for positive and negative BOLD response in the DMN and primary visual cortex overlaid on three orthogonal and most informative slices.