Isabell Katrin Bones1, Clemens Bos1, Chrit Moonen1, Jeroen Hendrikse2, and Marijn van Stralen1
1Center for Image Sciences, University Medical Center Utrecht, Utrecht, Netherlands, 2Department of Radiology, University Medical Center Utrecht, Utrecht, Netherlands
1Center for Image Sciences, University Medical Center Utrecht, Utrecht, Netherlands, 2Department of Radiology, University Medical Center Utrecht, Utrecht, Netherlands
Automatic and manual segmentations showed good agreement and delivered comparable cortical renal blood flow when used for ASL quantification. Thus, automatic segmentation using a cascade of U-nets makes renal ASL-MRI quantification feasible.
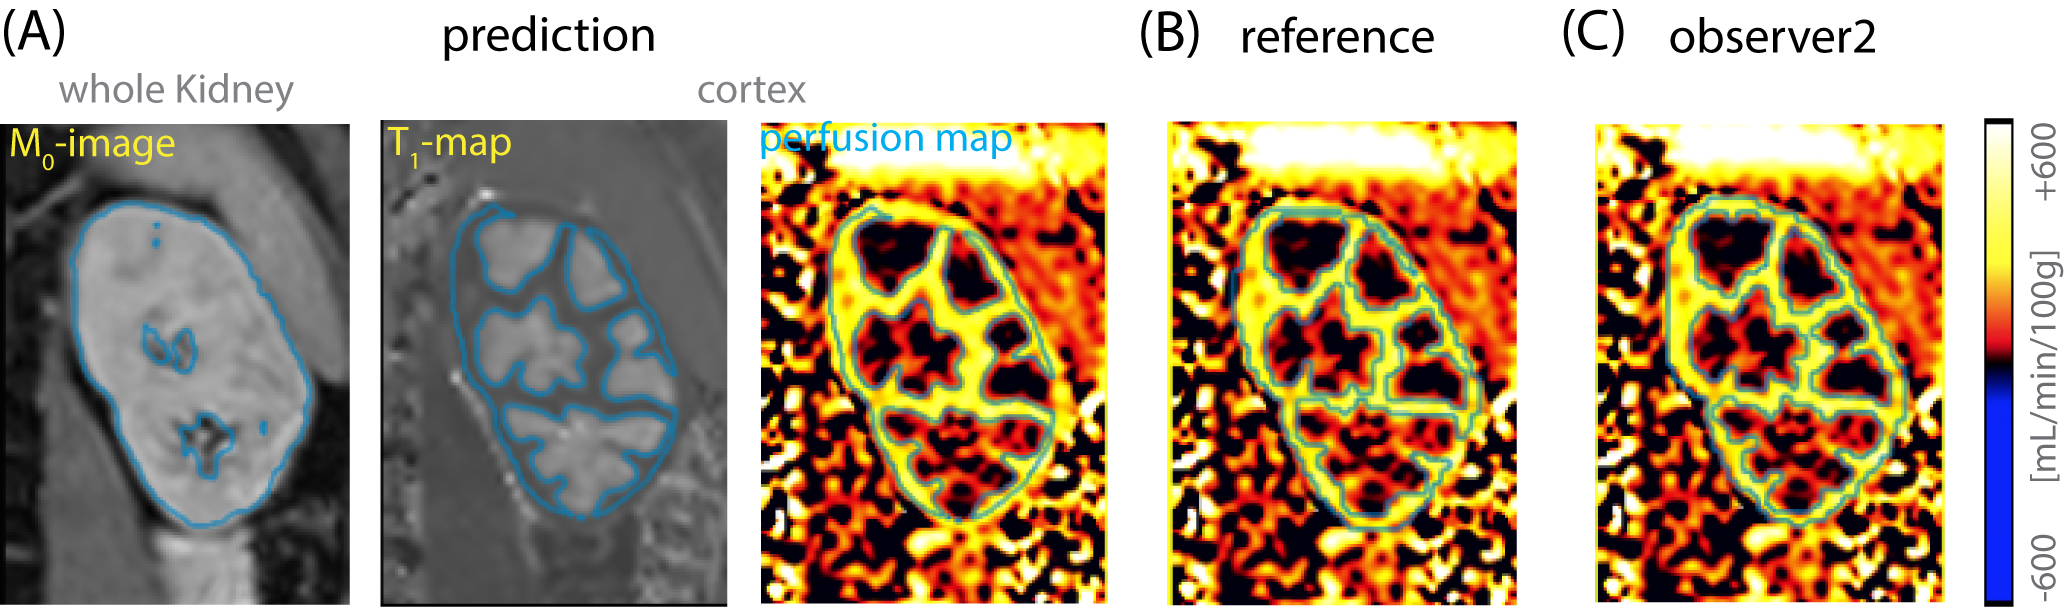
Single slice segmentation example. Segmentations are displayed in blue contours. (A) M0-image with whole kidney contours as a result from U-Ne2. T1-map and perfusion map with cortical contours as a result from U-Net3, corrected with U-Net2 output. (B) Reference cortical contours manually drawn by observer1. (C) Cortical contours manually drawn by observer2. Good agreement between the three different cortical contours can be seen; the bright cortical perfusion signal is captured by all contours, assuring accurate mean cortical RBF calculation.
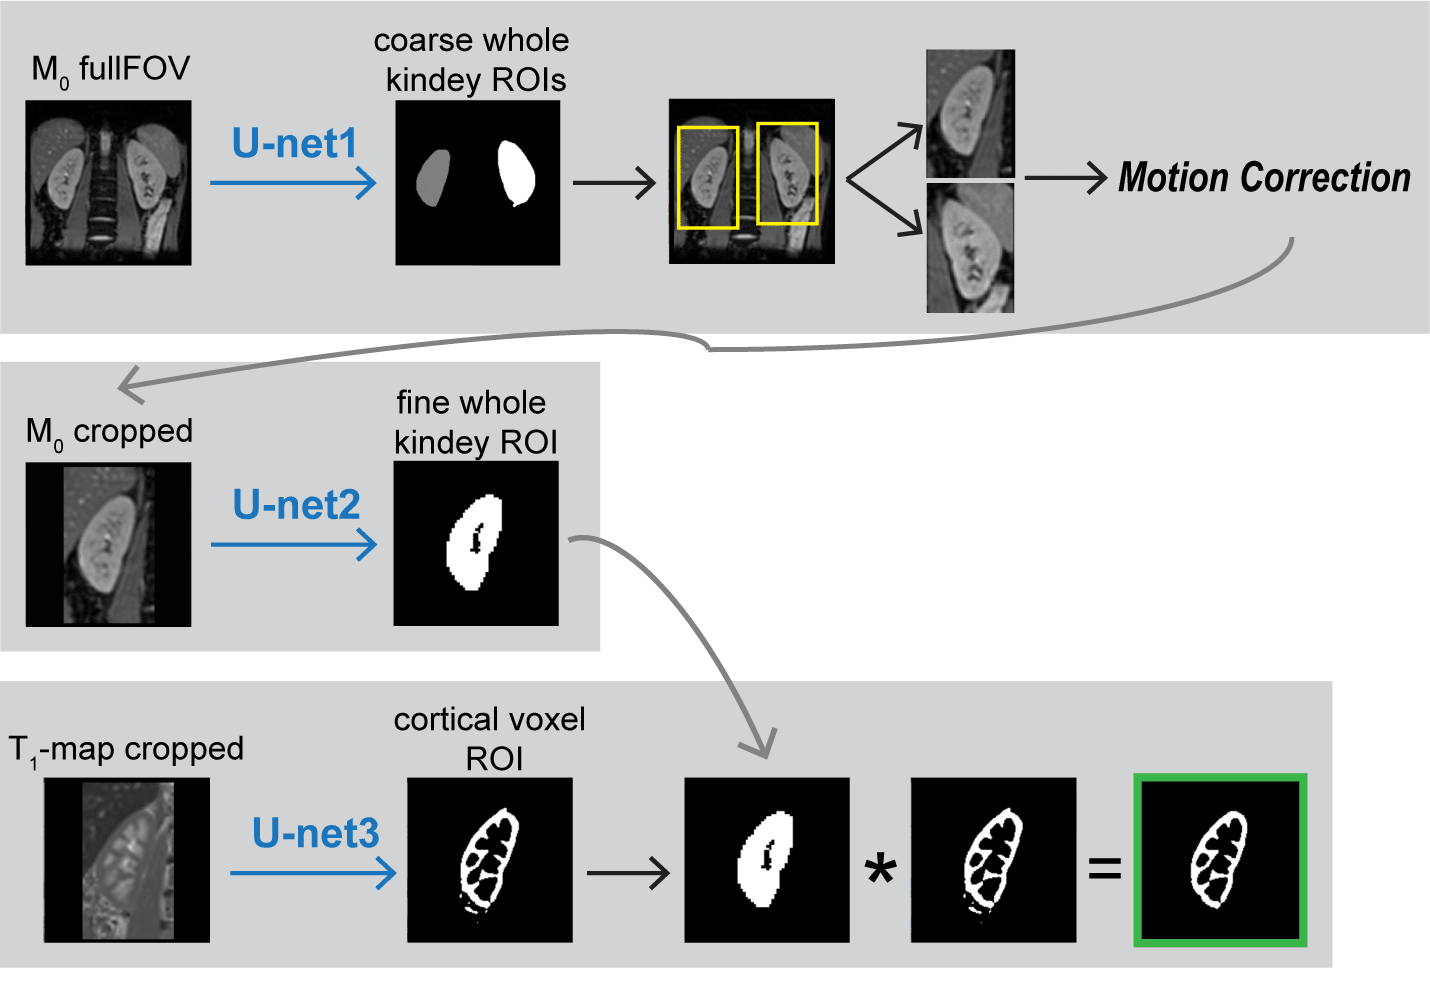
Graphic representation of our segmentation cascade for renal cortical voxel extraction. U-net1 roughly localizes both kidneys on full FOV M0-images. This information is used for image cropping, to remove background which permits faster image registration. U-net2 segments fine whole kidney masks on the cropped and registered M0-images. U-net3 is predicting cortical voxels from cropped and registered T1-maps. In a last step, the predicted cortical and whole kidney masks from U-Net2 and U-Net3 are combined to remove eventual erroneous cortical predictions outside of the kidney.