Huilou Liang1,2, Lianwang Li3, Yuchao Liang3, Siqi Cai4, Jing An5, Yan Zhuo1,2,6, Lijuan Zhang4, Danny JJ Wang7, and Rong Xue1,2,8
1State Key Laboratory of Brain and Cognitive Science, Beijing MRI Center for Brain Research, Institute of Biophysics, Chinese Academy of Sciences, Beijing, China, 2University of Chinese Academy of Sciences, Beijing, China, 3Department of Neurosurgery, Beijing Tiantan Hospital of Capital Medical University, Beijing, China, 4Shenzhen Institutes of Advanced Technology, Chinese Academy of Sciences, Shenzhen, China, 5Siemens Shenzhen Magnetic Resonance Ltd, Shenzhen, China, 6CAS Center for Excellence in Brain Science and Intelligence Technology, Chinese Academy of Sciences, Beijing, China, 7Mark & Mary Stevens Neuroimaging and Informatics Institute, Keck School of Medicine, University of Southern California, Los Angeles, CA, United States, 8Beijing Institute for Brain Disorders, Beijing, China
1State Key Laboratory of Brain and Cognitive Science, Beijing MRI Center for Brain Research, Institute of Biophysics, Chinese Academy of Sciences, Beijing, China, 2University of Chinese Academy of Sciences, Beijing, China, 3Department of Neurosurgery, Beijing Tiantan Hospital of Capital Medical University, Beijing, China, 4Shenzhen Institutes of Advanced Technology, Chinese Academy of Sciences, Shenzhen, China, 5Siemens Shenzhen Magnetic Resonance Ltd, Shenzhen, China, 6CAS Center for Excellence in Brain Science and Intelligence Technology, Chinese Academy of Sciences, Beijing, China, 7Mark & Mary Stevens Neuroimaging and Informatics Institute, Keck School of Medicine, University of Southern California, Los Angeles, CA, United States, 8Beijing Institute for Brain Disorders, Beijing, China
In
this study, we applied multi-delay 3D ASL with multi-parametric perfusion maps in
GBM patients. Our results show that aCBV based relative perfusion parameters
may provide a better performance in predicting IDH1 mutation status and is
worthy of further verification in future studies.
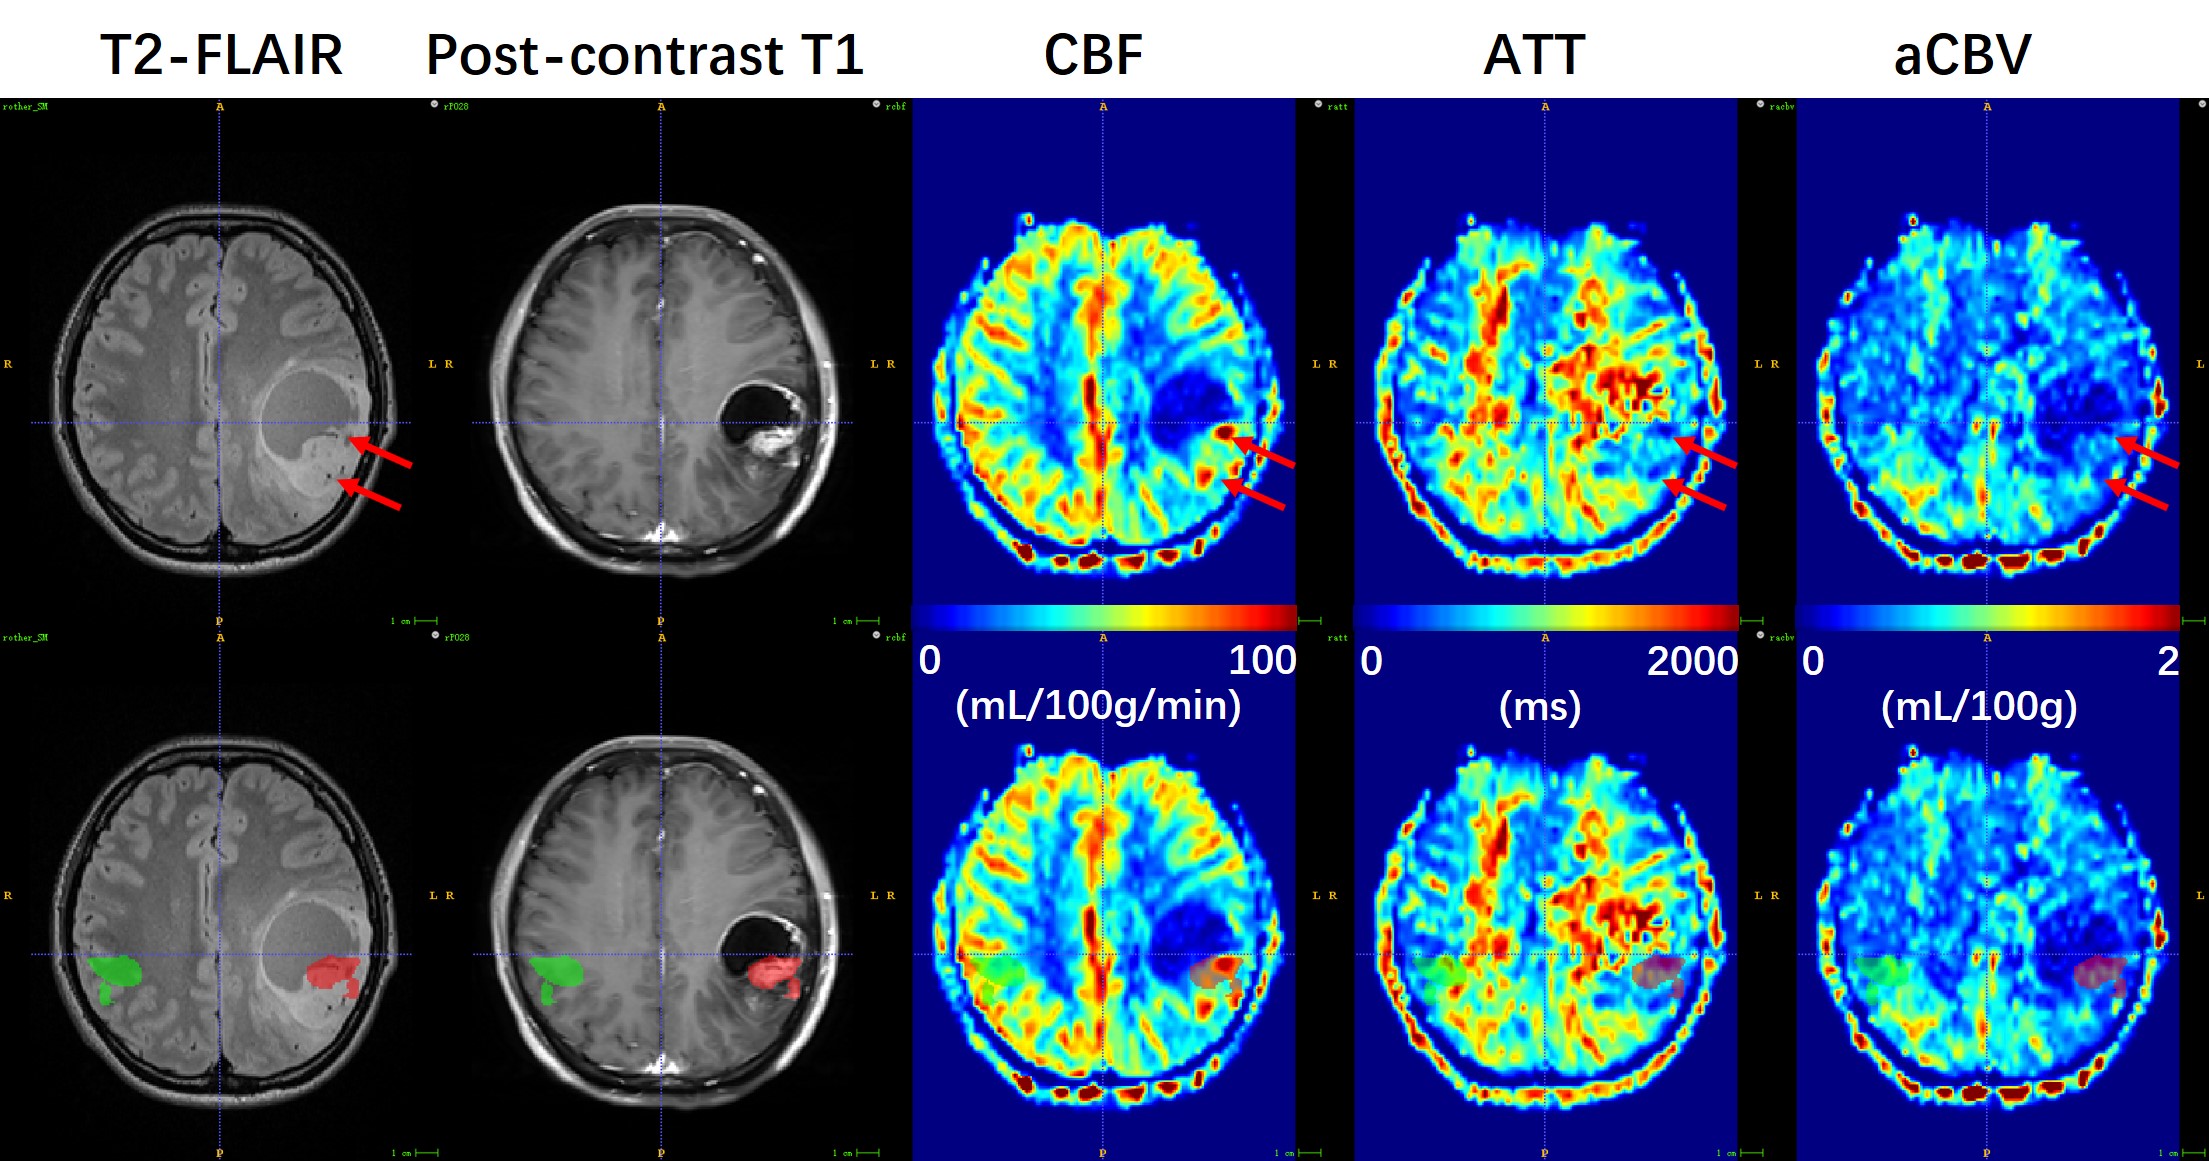
Figure 1. A 32-year-old woman (Patient #2) with
IDH1-mutant GBM. ROIs of tumoral (red) and mirrored
(green) regions were manually drawn on T2-FLAIR image referring to contrast-enhancing
regions in post-contrast T1 image, and successively overlaid
onto multi-parametric perfusion maps (lower row) to measure the maximum and
mean values within ROIs. As indicated by red arrows, the CBF map shows
obviously high values in regions of large vessels (confirmed by low ATT values)
within tumor found in T2-FLAIR image, whereas the aCBV map doesn’t display elevated
perfusion.

Figure 2. A 57-year-old man (Patient #4) with
IDH1-wild type GBM. ROIs of tumoral (red) and mirrored (green) regions were
manually delineated on T2-FLAIR image and overlaid onto multi-parametric
perfusion maps (lower row). Ring-enhancing lesions in post-contrast T1 image are
coincident with ring-like regions with hyper-perfusion in CBF and aCBV maps.
Prolonged ATT values especially in the occipital region are observed.