Lu Chen1, Guo-Yi Su1, Weiqiang Dou2, Yong Shen3, Fei-Yun Wu1, and Xiao-Quan Xu1
1Radiology, The First Affiliated Hospital of Nanjing Medical University, Nanjing, China, 2GE Healthcare, MR Research China, Beijing, P.R. China, Beijing, China, 3GE Healthcare, MR Enhanced Application China, Beijing, P.R. China, Beijing, China
1Radiology, The First Affiliated Hospital of Nanjing Medical University, Nanjing, China, 2GE Healthcare, MR Research China, Beijing, P.R. China, Beijing, China, 3GE Healthcare, MR Enhanced Application China, Beijing, P.R. China, Beijing, China
3D pcASL MRI, especially with short PLD was suggested to evaluate patients with parotid gland tumors in routine clinical practice.
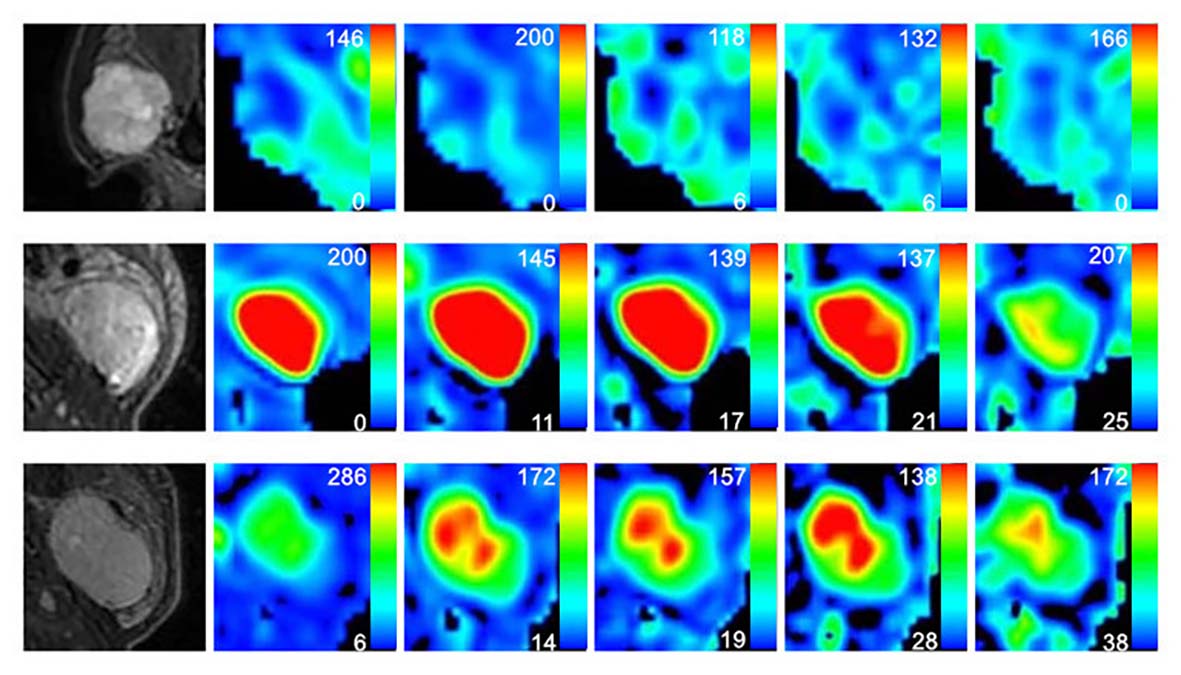
Figure 2. Representative images of PA (A-F), WT (J-L) and squamous cell carcinoma (M-R). The first column was the fat-suppressed T2-weighted image (A, J, M). The second (B, H, N), third (C, I, O), fourth (D, J, P), fifth (E, K, Q) and sixth (F, L, R) columns were TBF maps at different PLDs (PLD=1025ms, 1525ms, 2025ms, 2525ms, 3025ms), respectively. WT (H-L) showed relatively highest TBF, followed by squamous cell carcinoma (N-R) and PA (B-F). The unit of TBF is ml/100g/min. TBF= tumor blood flow; PLDs= post-labeling delay times; PAs= pleomorphic adenomas; WTs= warthin’s tumors.
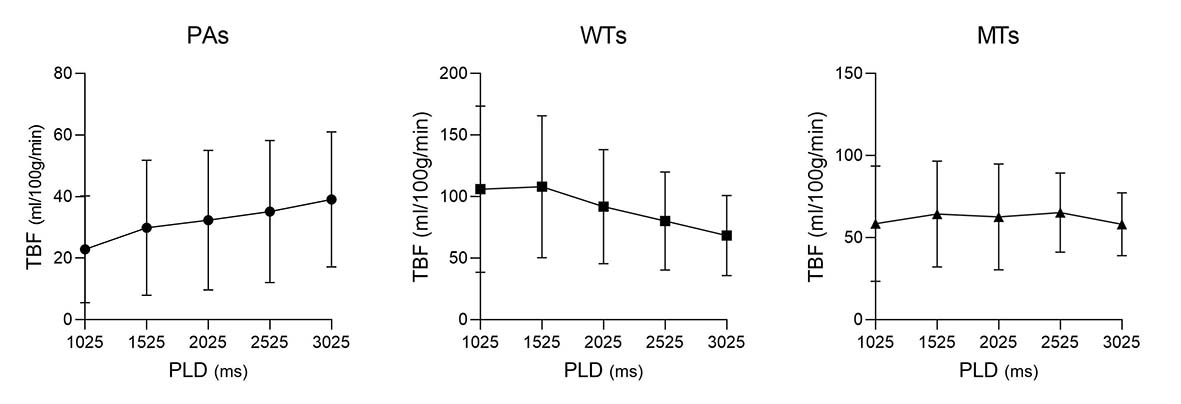
Figure 1. Line graphs showing the changes of TBF at different PLDs. TBF= tumor blood flow; PLDs= post-labeling delay times; PAs= pleomorphic adenomas; WTs= warthin’s tumors; MTs= malignant tumors.