Veronica Ravano1,2,3, Gian Franco Piredda1,2,3, Manuela Vaneckova4, Jan Krasensky4, Michaela Andelova5, Tomas Uher5, Barbora Srpova5, Eva Kubala Havrdova5, Karolina Vodehnalova5, Dana Horakova5, Tom Hilbert1,2,3, Bénédicte Maréchal1,2,3, Reto Meuli2, Jean-Philippe Thiran2,3, Tobias Kober1,2,3, and Jonas Richiardi2
1Advanced Clinical Imaging Technology, Siemens Healthineers, Lausanne, Switzerland, 2Department of Radiology, Lausanne University Hospital and University of Lausanne, Lausanne, Switzerland, 3LTS5, Ecole Polytechnique Fédérale de Lausanne, Lausanne, Switzerland, 4Department of Radiology, First Faculty of Medicine, Charles University and General University Hospital, Prague, Czech Republic, 5Department of Neurology and Center of Clinical Neuroscience, First Faculty of Medicine, Charles University and General University Hospital, Prague, Czech Republic
1Advanced Clinical Imaging Technology, Siemens Healthineers, Lausanne, Switzerland, 2Department of Radiology, Lausanne University Hospital and University of Lausanne, Lausanne, Switzerland, 3LTS5, Ecole Polytechnique Fédérale de Lausanne, Lausanne, Switzerland, 4Department of Radiology, First Faculty of Medicine, Charles University and General University Hospital, Prague, Czech Republic, 5Department of Neurology and Center of Clinical Neuroscience, First Faculty of Medicine, Charles University and General University Hospital, Prague, Czech Republic
Evaluating
T1 relaxometry abnormalities in normal-appearing WM along
atlas-based WM tracts improves correlation to clinical multiple sclerosis scores compared
to standard metrics based on lesion load. Infratentorial tracts were found to
be the most strongly correlated with disability.

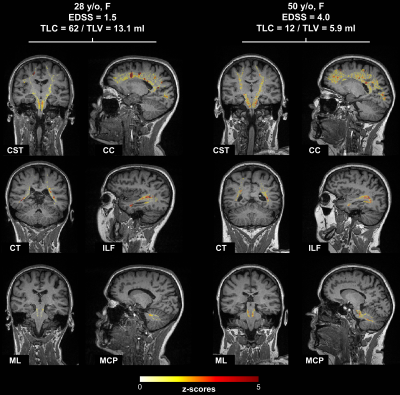
Figure 1. Representative distributions of T1 z-scores in example
WM tracts of two patients with different Expanded Disability Status Scale
(EDSS) score overlayed on the MPRAGE contrast. A more severe alteration of WM
tissues was found in the patient with higher EDSS. WM tracts abbreviations:
CST: cortico spinal tract; CC: corpus callosum; CT: corticothalamic pathway; ILF:
inferior longitudinal fasciculus; ML: medial lemniscus; MCP: middle cerebellar
peduncle.

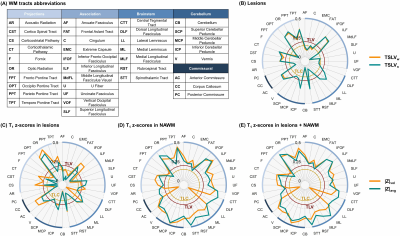
Figure 2. Spearman correlations of WM tract-specific metrics
with EDSS scores. (A) Table of WM tract names and corresponding abbreviations
arranged into the five main brain pathways categories (namely association,
projection, brainstem, cerebellum and commissural). (B) Tract-specific lesion
loads compared to Total Lesion Volume (TLV) and Total Lesion Count (TLC). (C) Tract-specific
T1 abnormalities within lesions. (D) Tract-specific T1 abnormalities in NAWM. (E)
Tract-specific T1 abnormalities in the whole WM (NAWM + lesions).
