Arzu Ceylan Has Silemek1, Guido Nolte2, Jana Pöttgen1,3, Andreas K. Engel4, Christoph Heesen1,3, Stefan M. Gold1,5, and Jan-Patrick Stellmann6,7
1Institute of Neuroimmunology and Multiple Sclerosis (INIMS), University Medical Center Eppendorf, Hamburg, Germany, 2Department of Neurophysiology and Pathophysiology, University Medical Center Eppendorf, Hamburg, Germany, 3Department of Neurology, University Medical Center Eppendorf, Hamburg, Germany, 4Institute of Neurophysiology and Pathophysiology, University Medical Center Eppendorf, Hamburg, Germany, 5Department of Psychiatry and Psychotherapy, Charité University Medical Center, Campus Benjamin Franklin, Hindenburgdamm 30, Berlin, Germany, 6CRMBM AMU-CNRS, Aix-Marseille Université, Marseille, France, 7CEMEREM, APHM, CHU Timone, Marseille, France
1Institute of Neuroimmunology and Multiple Sclerosis (INIMS), University Medical Center Eppendorf, Hamburg, Germany, 2Department of Neurophysiology and Pathophysiology, University Medical Center Eppendorf, Hamburg, Germany, 3Department of Neurology, University Medical Center Eppendorf, Hamburg, Germany, 4Institute of Neurophysiology and Pathophysiology, University Medical Center Eppendorf, Hamburg, Germany, 5Department of Psychiatry and Psychotherapy, Charité University Medical Center, Campus Benjamin Franklin, Hindenburgdamm 30, Berlin, Germany, 6CRMBM AMU-CNRS, Aix-Marseille Université, Marseille, France, 7CEMEREM, APHM, CHU Timone, Marseille, France
The
effect of disability progression on network organization was estimated in RRMS.
Structural connectivity was more sensitive to show a relation with a cognitive function
over 2 years than fMRI and MEG metrics in MS. This study underline the
difficulties related with functional imaging in MS.
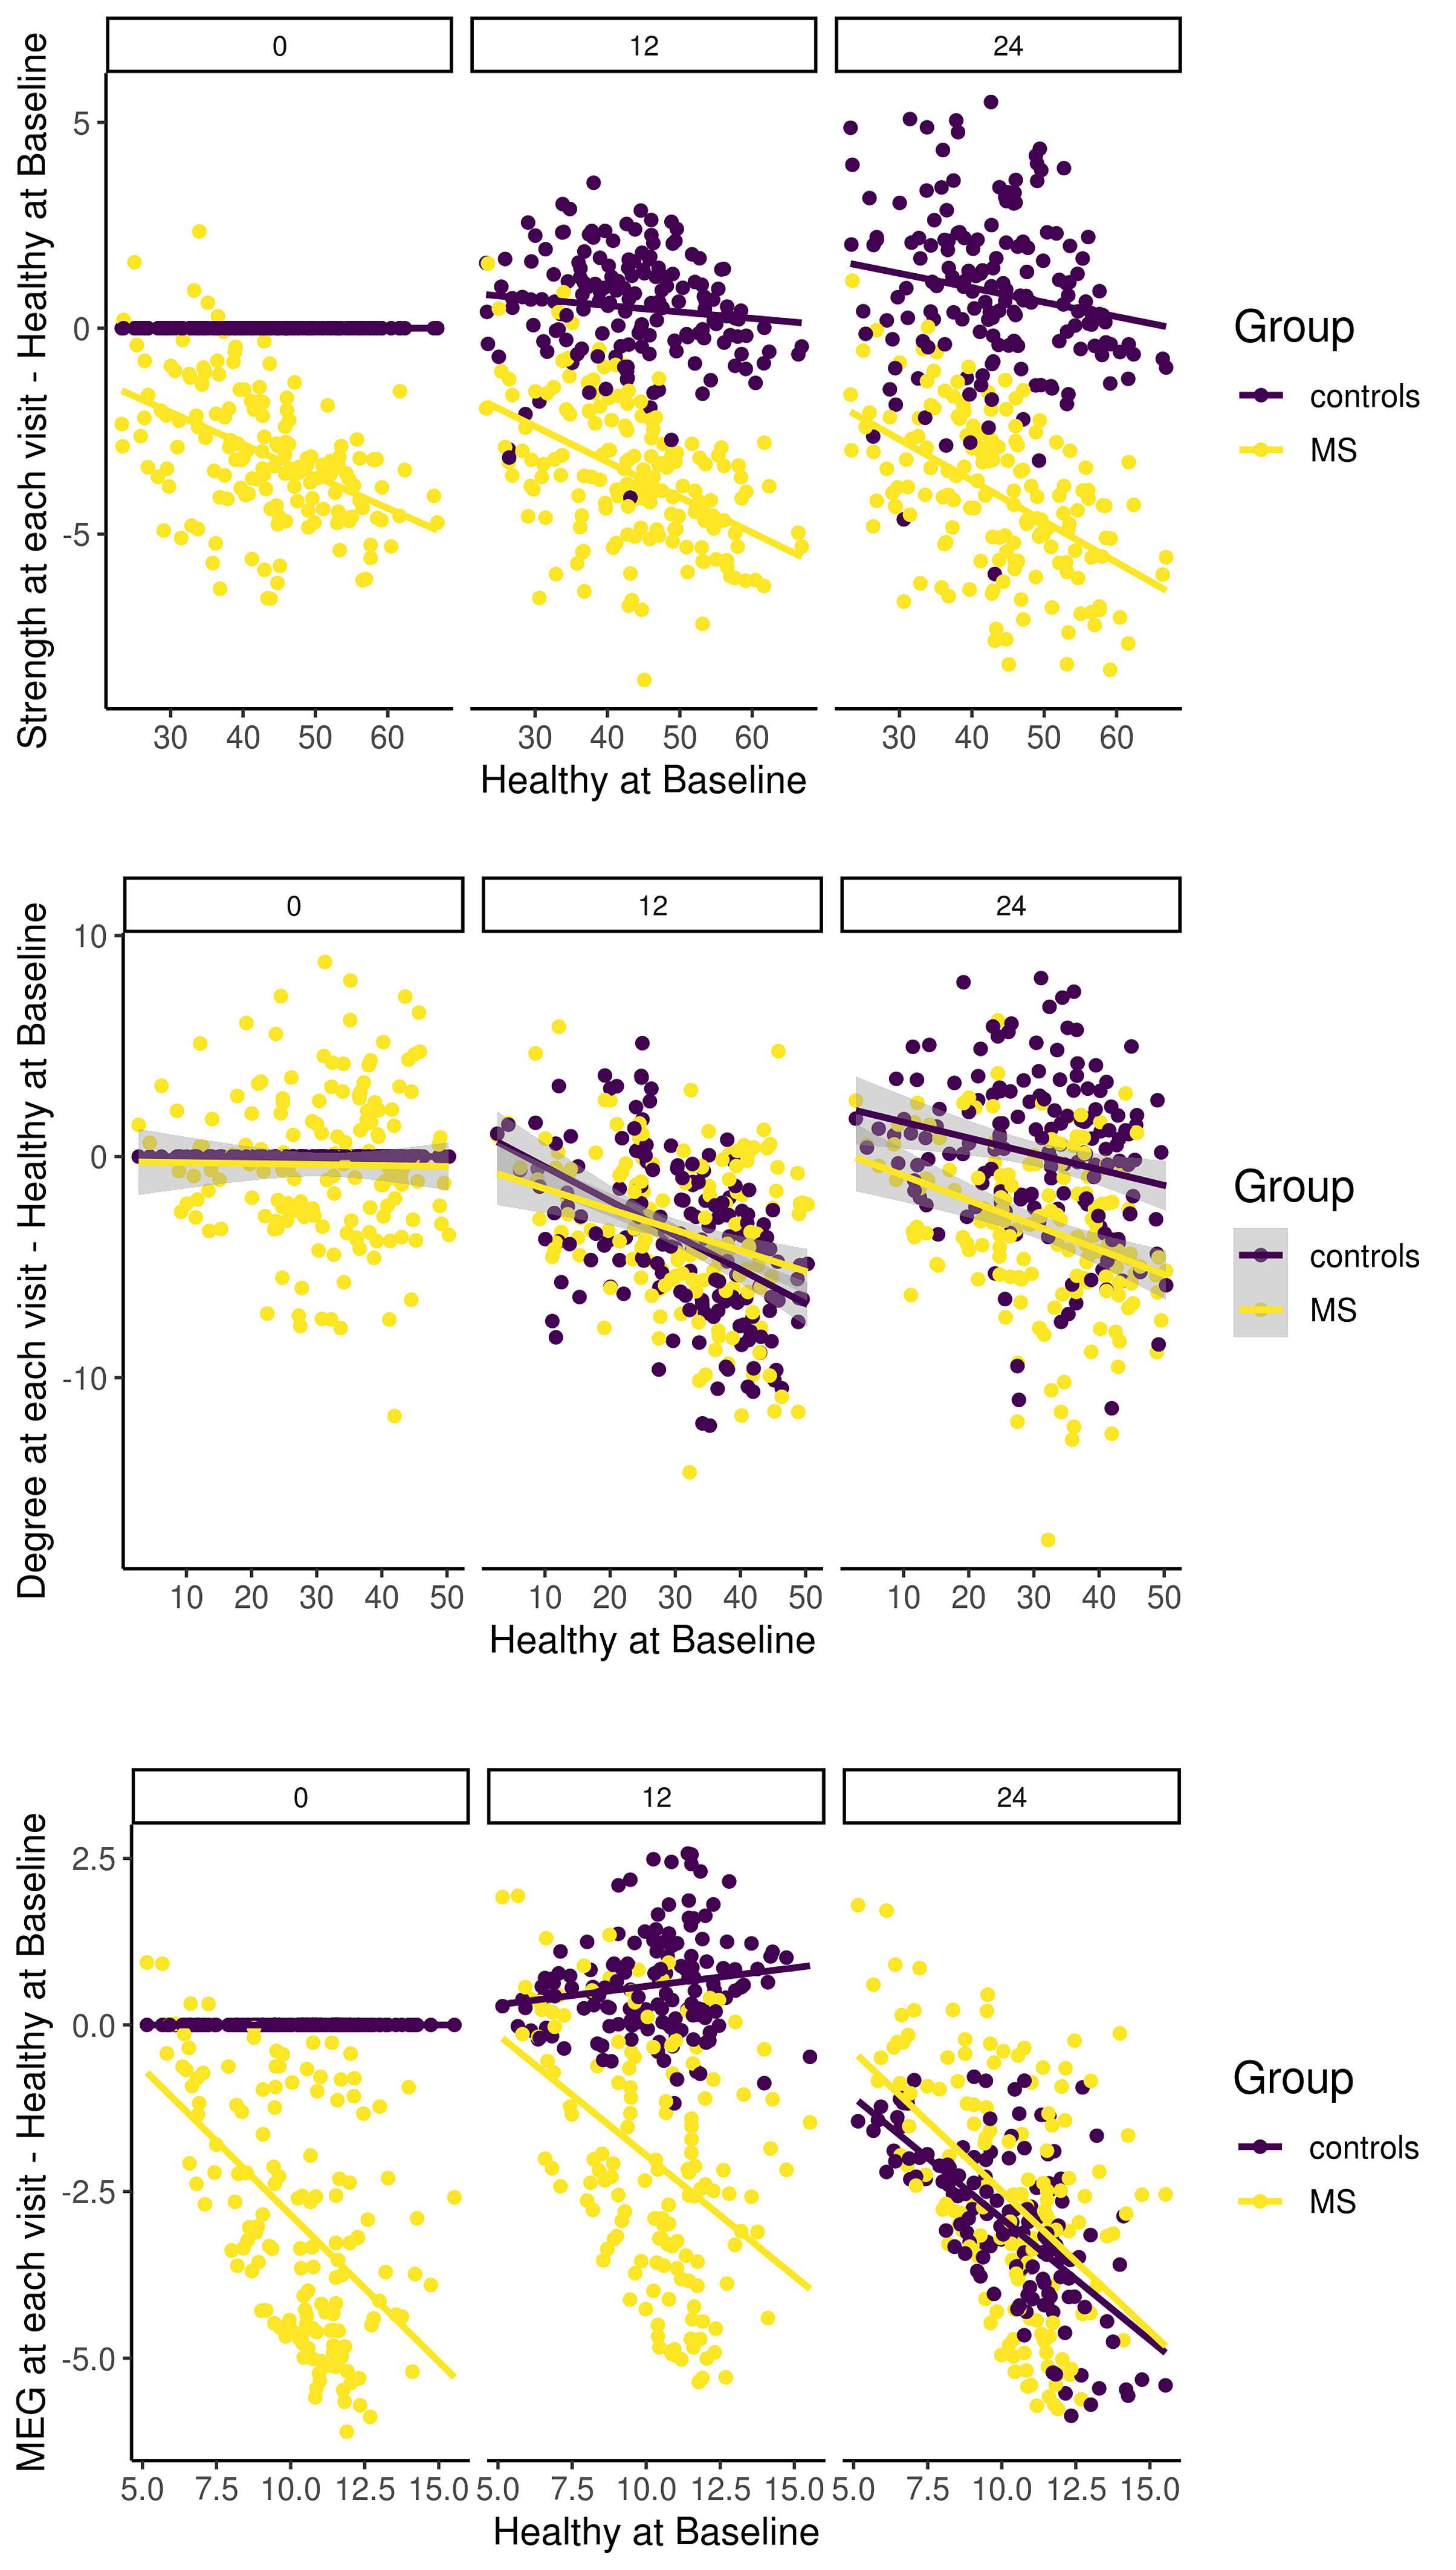
Figure 2. Hub disruption over 2 years in patients (yellow) and HC (purple). Header of
the each plot indicates the visit month. Each imaging metric is shown from up to down as DTI, rs-fMRI
and MEG respectively. The mean connectivity of each node of each metric in the group
of controls at baseline (x axis, ⟨Healthy at Baseline⟩) is plotted versus
the difference between groups in mean connectivity of each node of each metric
in each group at each visit and mean connectivity of each node of each metric
in the group of controls at baseline (y axis, ⟨Groups at each visit
– Healthy at Baseline⟩).
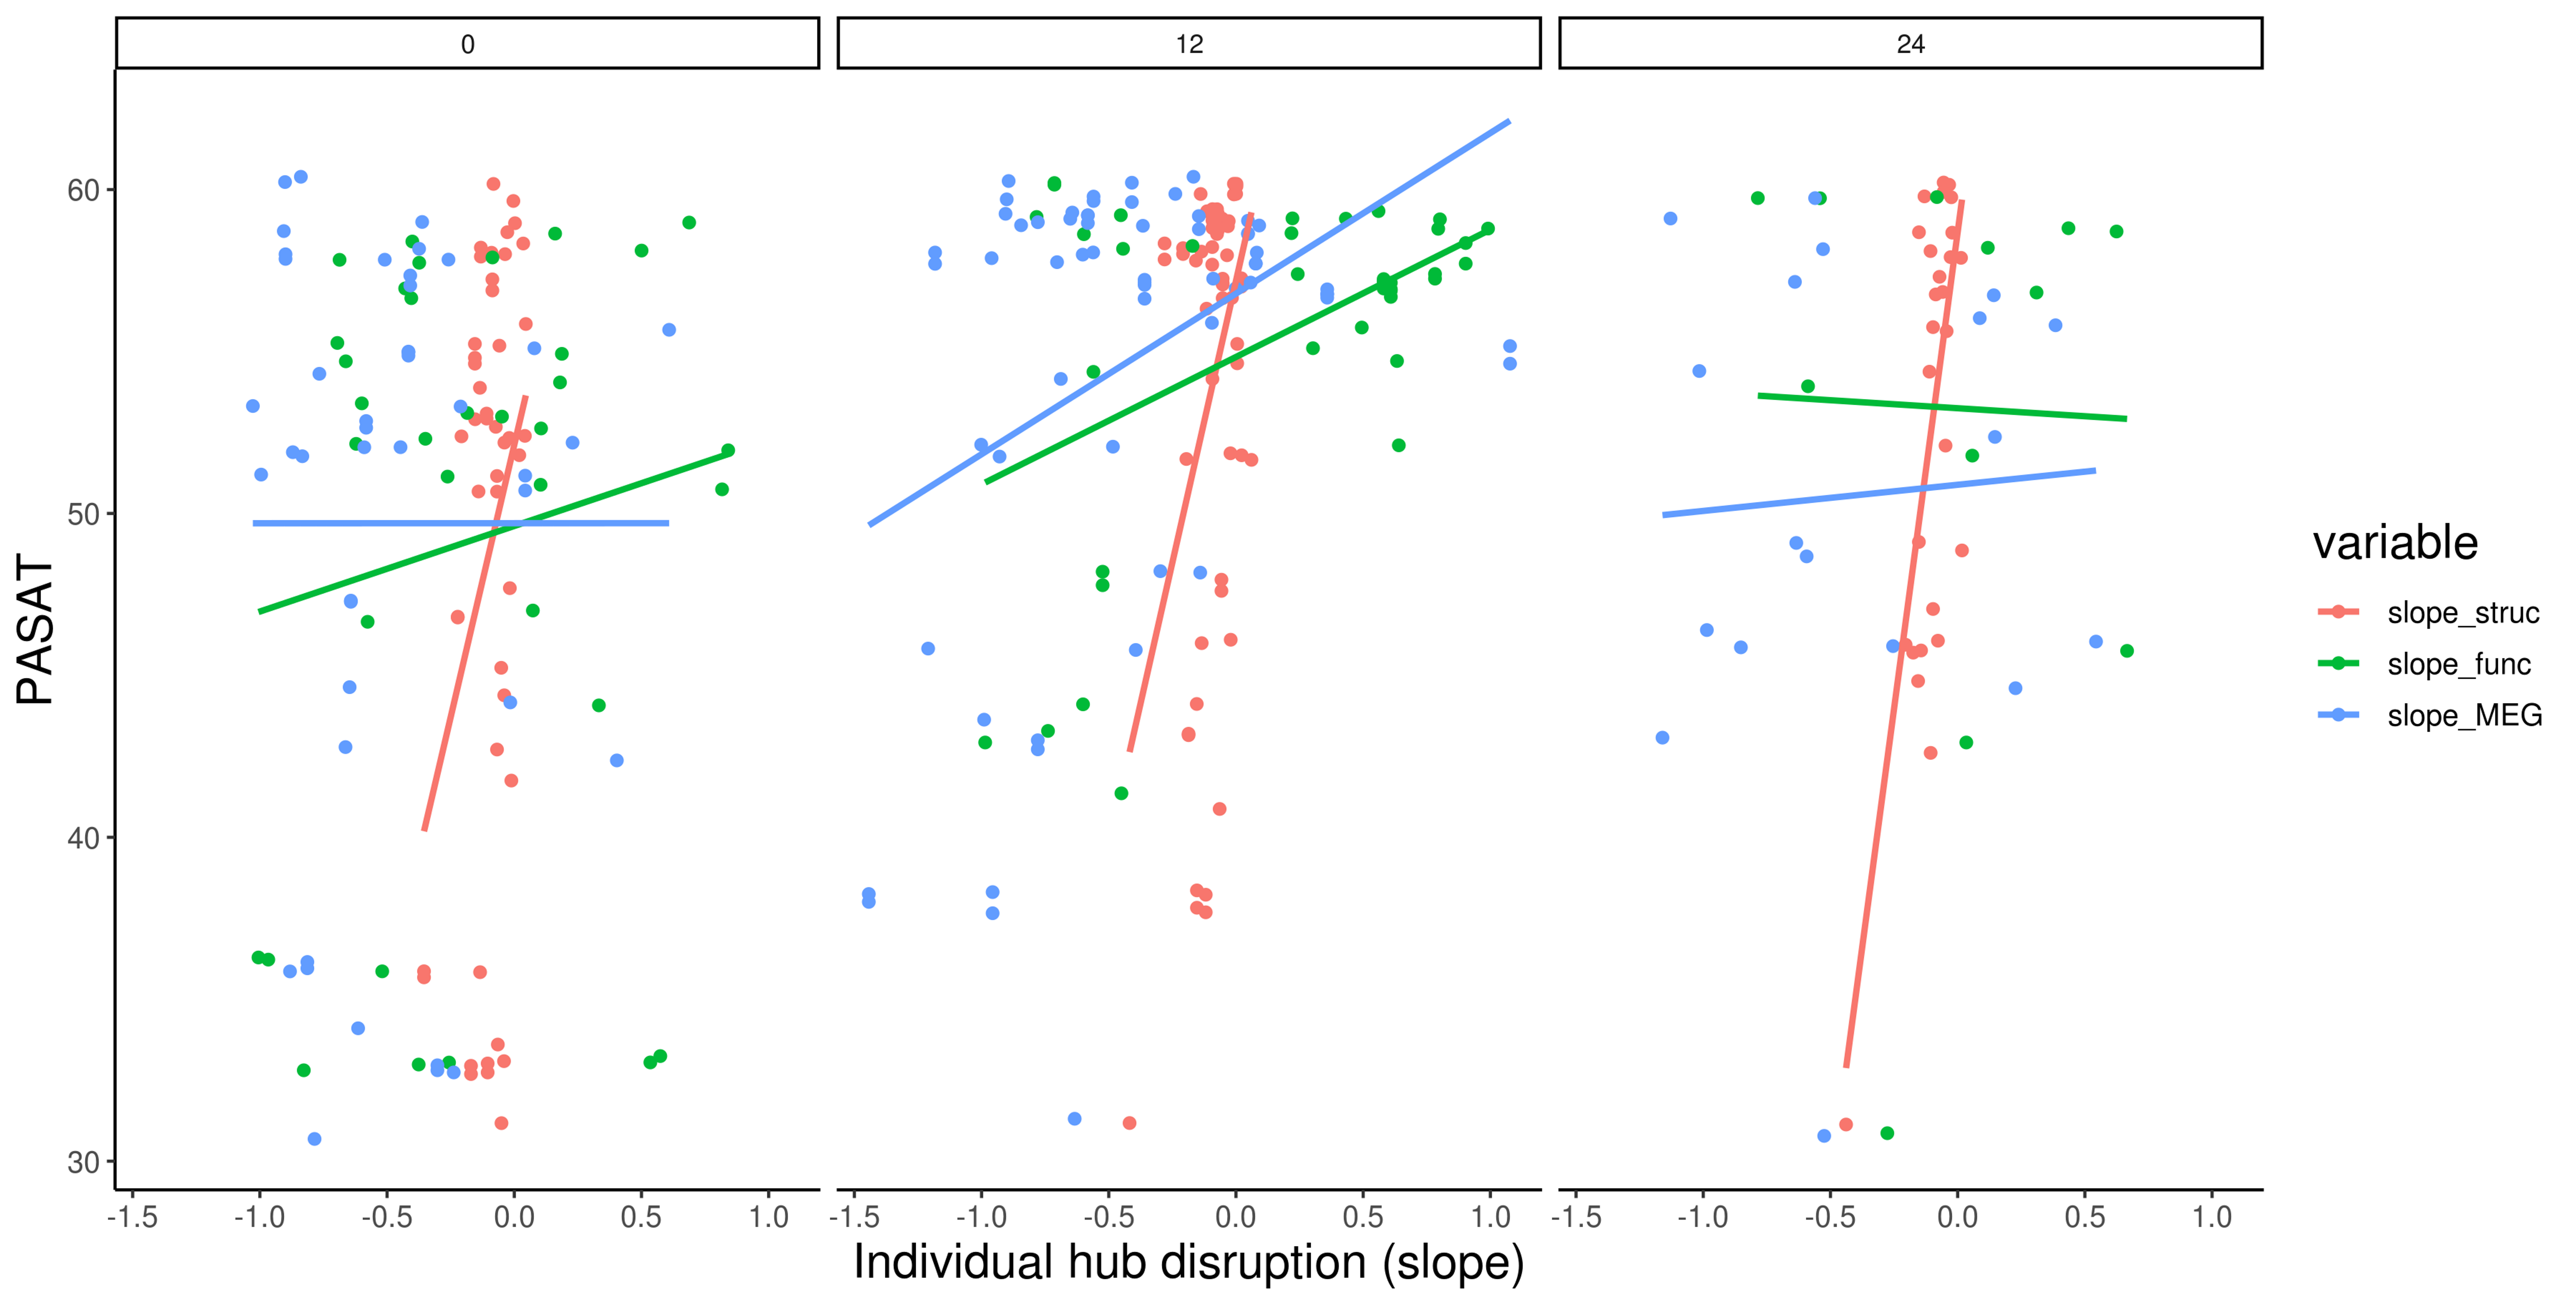
Figure 3. The correlation between individual hub
disruption of each imaging metric and PASAT performance over 2 years in MS.
Header of the each plotshows the visit month (0: baseline, 12: 1-year, 24:
2-year). Orange, green and blue indicate the structural, rs-fMRI and MEG hub
disruption respectively. Slope of each imaging metric (x axis) is the
ratio of the mean connectivity of each node in the group of controls at
baseline to the the difference in connectivity of each node of each
subject at each visit and mean connectivity of each node in the group of
controls at baseline.