Muhamed Barakovic1,2,3, Riccardo Galbusera1,2,3, Reza Rahmanzadeh1,2,3, Matthias Weigel1,2,3, Po-Jui Lu1,2,3, Erik Bahn4, Simona Schiavi5, Alessandro Daducci5, Pascal Sati6,7, Pietro Maggi8,9, Ludwig Kappos2,3, Jens Kuhle2,3, Laura Gaetano10, Stefano Magon11, and Cristina Granziera1,2,3
1Translational Imaging in Neurology (ThINk) Basel, University Hospital Basel and University of Basel, Basel, Switzerland, 2Neurologic Clinic and Policlinic, University Hospital Basel and University of Basel, Basel, Switzerland, 3Research Center for Clinical Neuroimmunology and Neuroscience (RC2NB) Basel, University Hospital Basel and University of Basel, Basel, Switzerland, 4Institute of Neuropathology, University Medical Center, Göttingen, Germany, 5Department of Computer Science, University of Verona, Verona, Italy, 6Translational Neuroradiology Section, National Institute of Neurological Disorders and Stroke, Bethesda, MD, United States, 7Department of Neurology, Cedars-Sinai Medical Center, Los Angeles, CA, United States, 8Department of Neurology, Lausanne University Hospital, Lausanne, Switzerland, 9Cliniques universitaires Saint Luc, Université catholique de Louvain, Louvain, Belgium, 10F. Hoffmann-La Roche Ltd., Basel, Switzerland, 11Pharmaceutical Research and Early Development, Roche Innovation Center Basel F. Hoffmann-La Roche Ltd., Basel, Switzerland
1Translational Imaging in Neurology (ThINk) Basel, University Hospital Basel and University of Basel, Basel, Switzerland, 2Neurologic Clinic and Policlinic, University Hospital Basel and University of Basel, Basel, Switzerland, 3Research Center for Clinical Neuroimmunology and Neuroscience (RC2NB) Basel, University Hospital Basel and University of Basel, Basel, Switzerland, 4Institute of Neuropathology, University Medical Center, Göttingen, Germany, 5Department of Computer Science, University of Verona, Verona, Italy, 6Translational Neuroradiology Section, National Institute of Neurological Disorders and Stroke, Bethesda, MD, United States, 7Department of Neurology, Cedars-Sinai Medical Center, Los Angeles, CA, United States, 8Department of Neurology, Lausanne University Hospital, Lausanne, Switzerland, 9Cliniques universitaires Saint Luc, Université catholique de Louvain, Louvain, Belgium, 10F. Hoffmann-La Roche Ltd., Basel, Switzerland, 11Pharmaceutical Research and Early Development, Roche Innovation Center Basel F. Hoffmann-La Roche Ltd., Basel, Switzerland
Paramagnetic rim lesions (PRL) are characterized by heterogeneous damage in multiple sclerosis (MS) patients. In this study we acquired in vivo, postmortem and histopathology with the aim to further characterize the microstructural properties of these lesions.
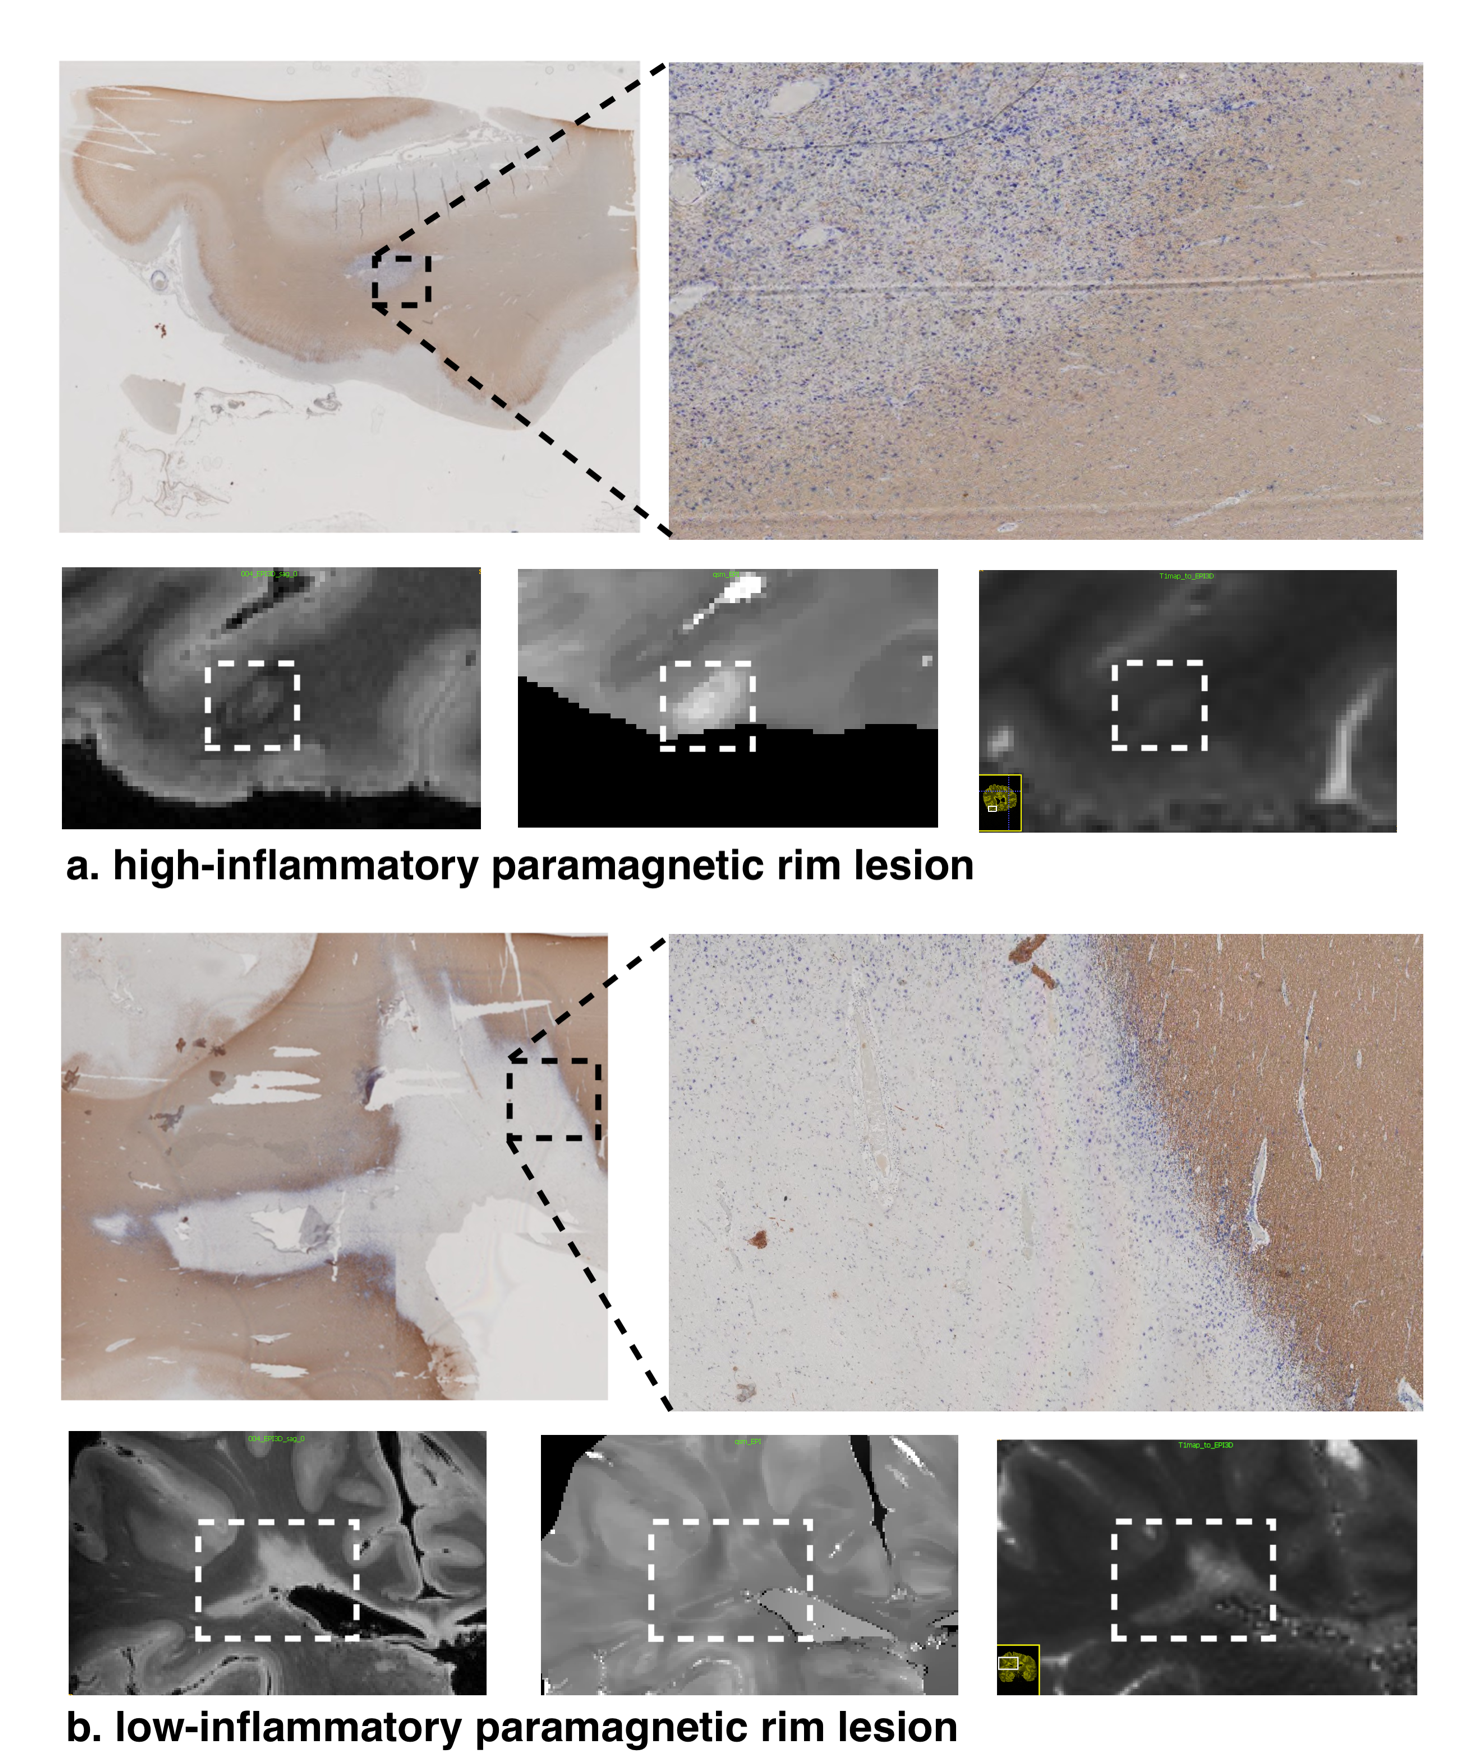
Figure 1: Post mortem images showing an exemplary high-inflammatory PRL (a.) and a low-inflammatory PRL (b). (top) Double immunohistochemistry of myelin basic-protein (MBP) (brown) with CR3/43 (MHC II, (blue) in an exemplary highly inflamed PRL (box, a.) and low-inflammatory PRL (box, b.) On the bottom, 3D EPI, QSM derived from 3D EPI and qT1 derived from MP2RAGE.
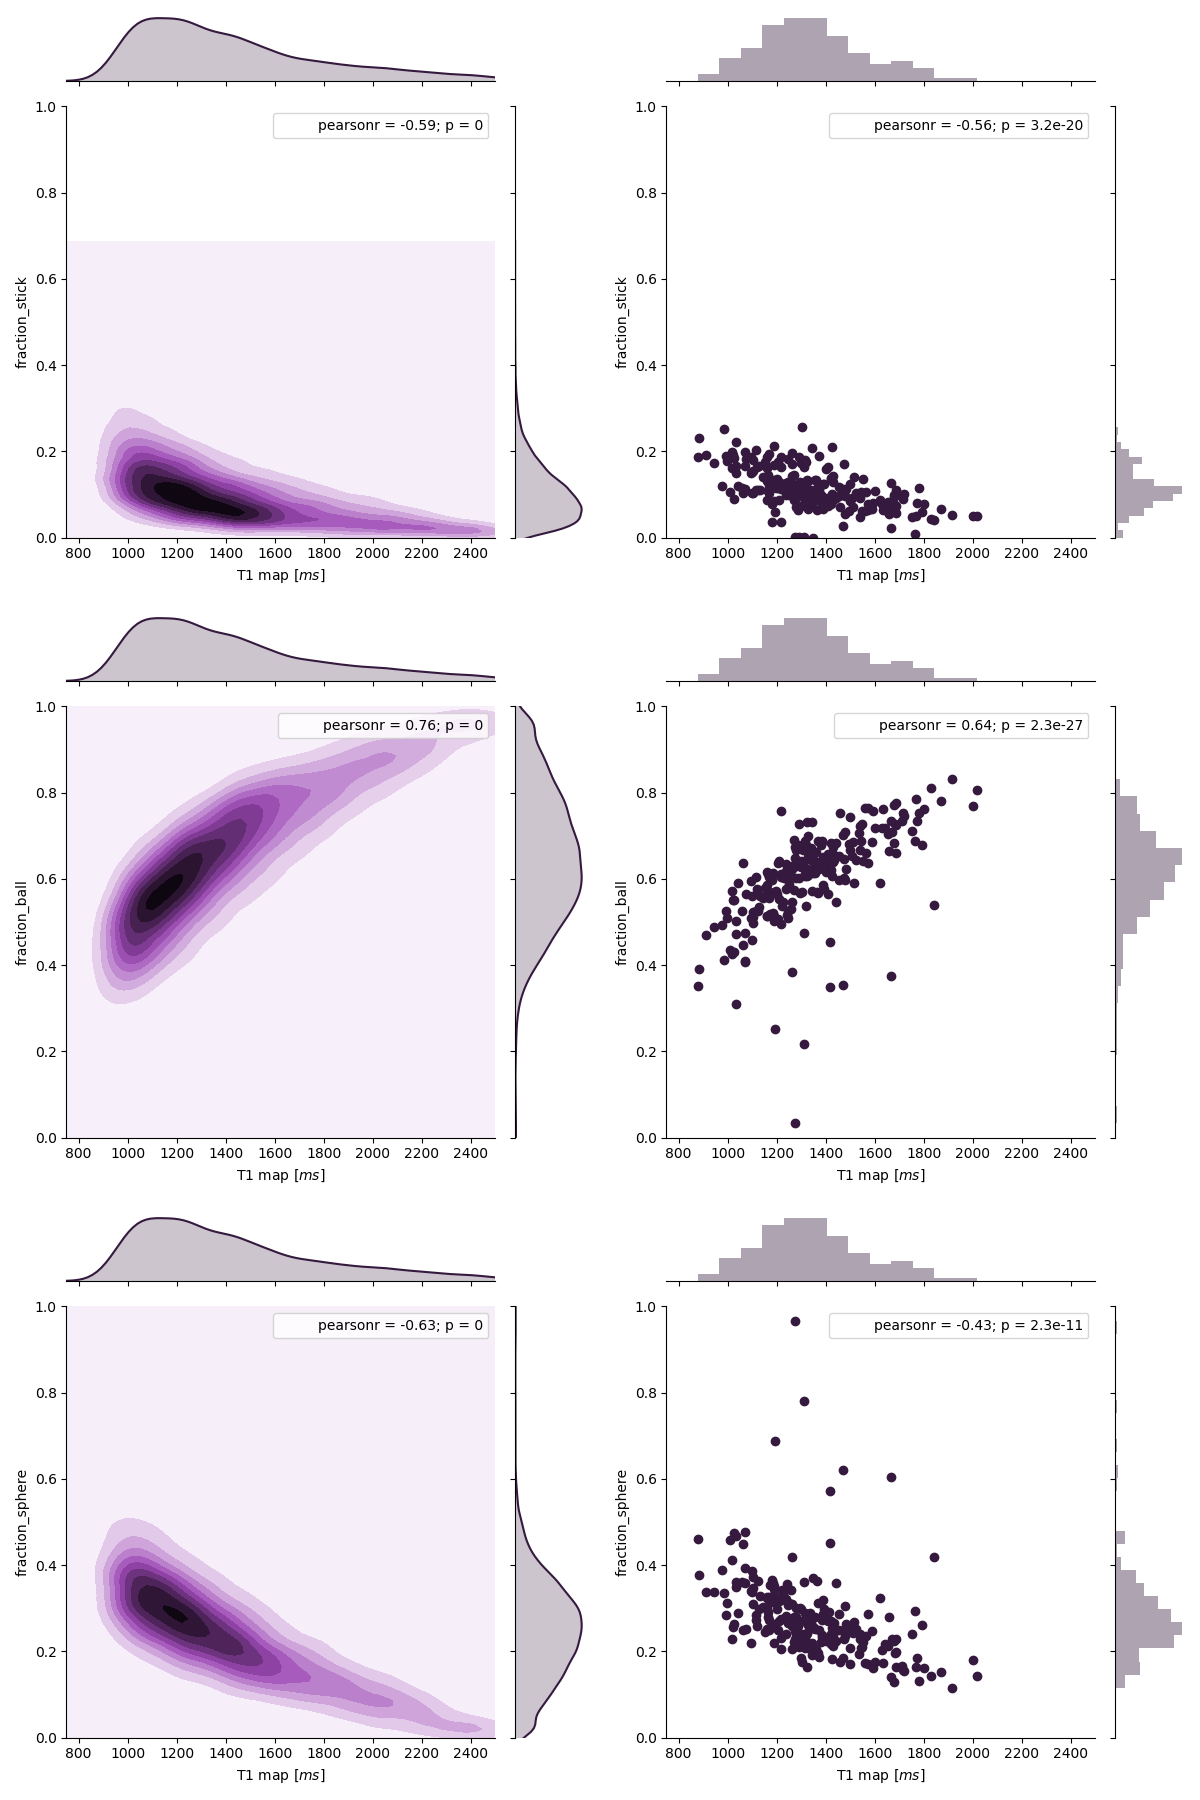
Figure 2. Joint plot showing the relationship between qT1 and diffusion parameters estimated from multi-shell diffusion MRI. Left: Voxel-wise joint plot with kernel density estimate (KDE) Right: Lesion-wise plot showing the relationship between qT1 and diffusion parameters using a scatter plot. First row: stick fraction, representing the intra-cellular component. Second row: ball fraction, representing the extra-cellular unrestricted component. Third row: sphere fraction, representing the extra-cellular restricted component.