Aly Khalifa1 and Michael D Noseworthy2,3
1Department of Medical Biophysics, University of Toronto, Toronto, ON, Canada, 2Electrical and Computer Engineering, McMaster University, Hamilton, ON, Canada, 3School of Biomedical Engineering, McMaster University, Hamilton, ON, Canada
1Department of Medical Biophysics, University of Toronto, Toronto, ON, Canada, 2Electrical and Computer Engineering, McMaster University, Hamilton, ON, Canada, 3School of Biomedical Engineering, McMaster University, Hamilton, ON, Canada
Susceptibility weighted imaging (SWI) was used to correlate brain regional iron levels with disease severity in the four subtypes of multiple sclerosis (MS).
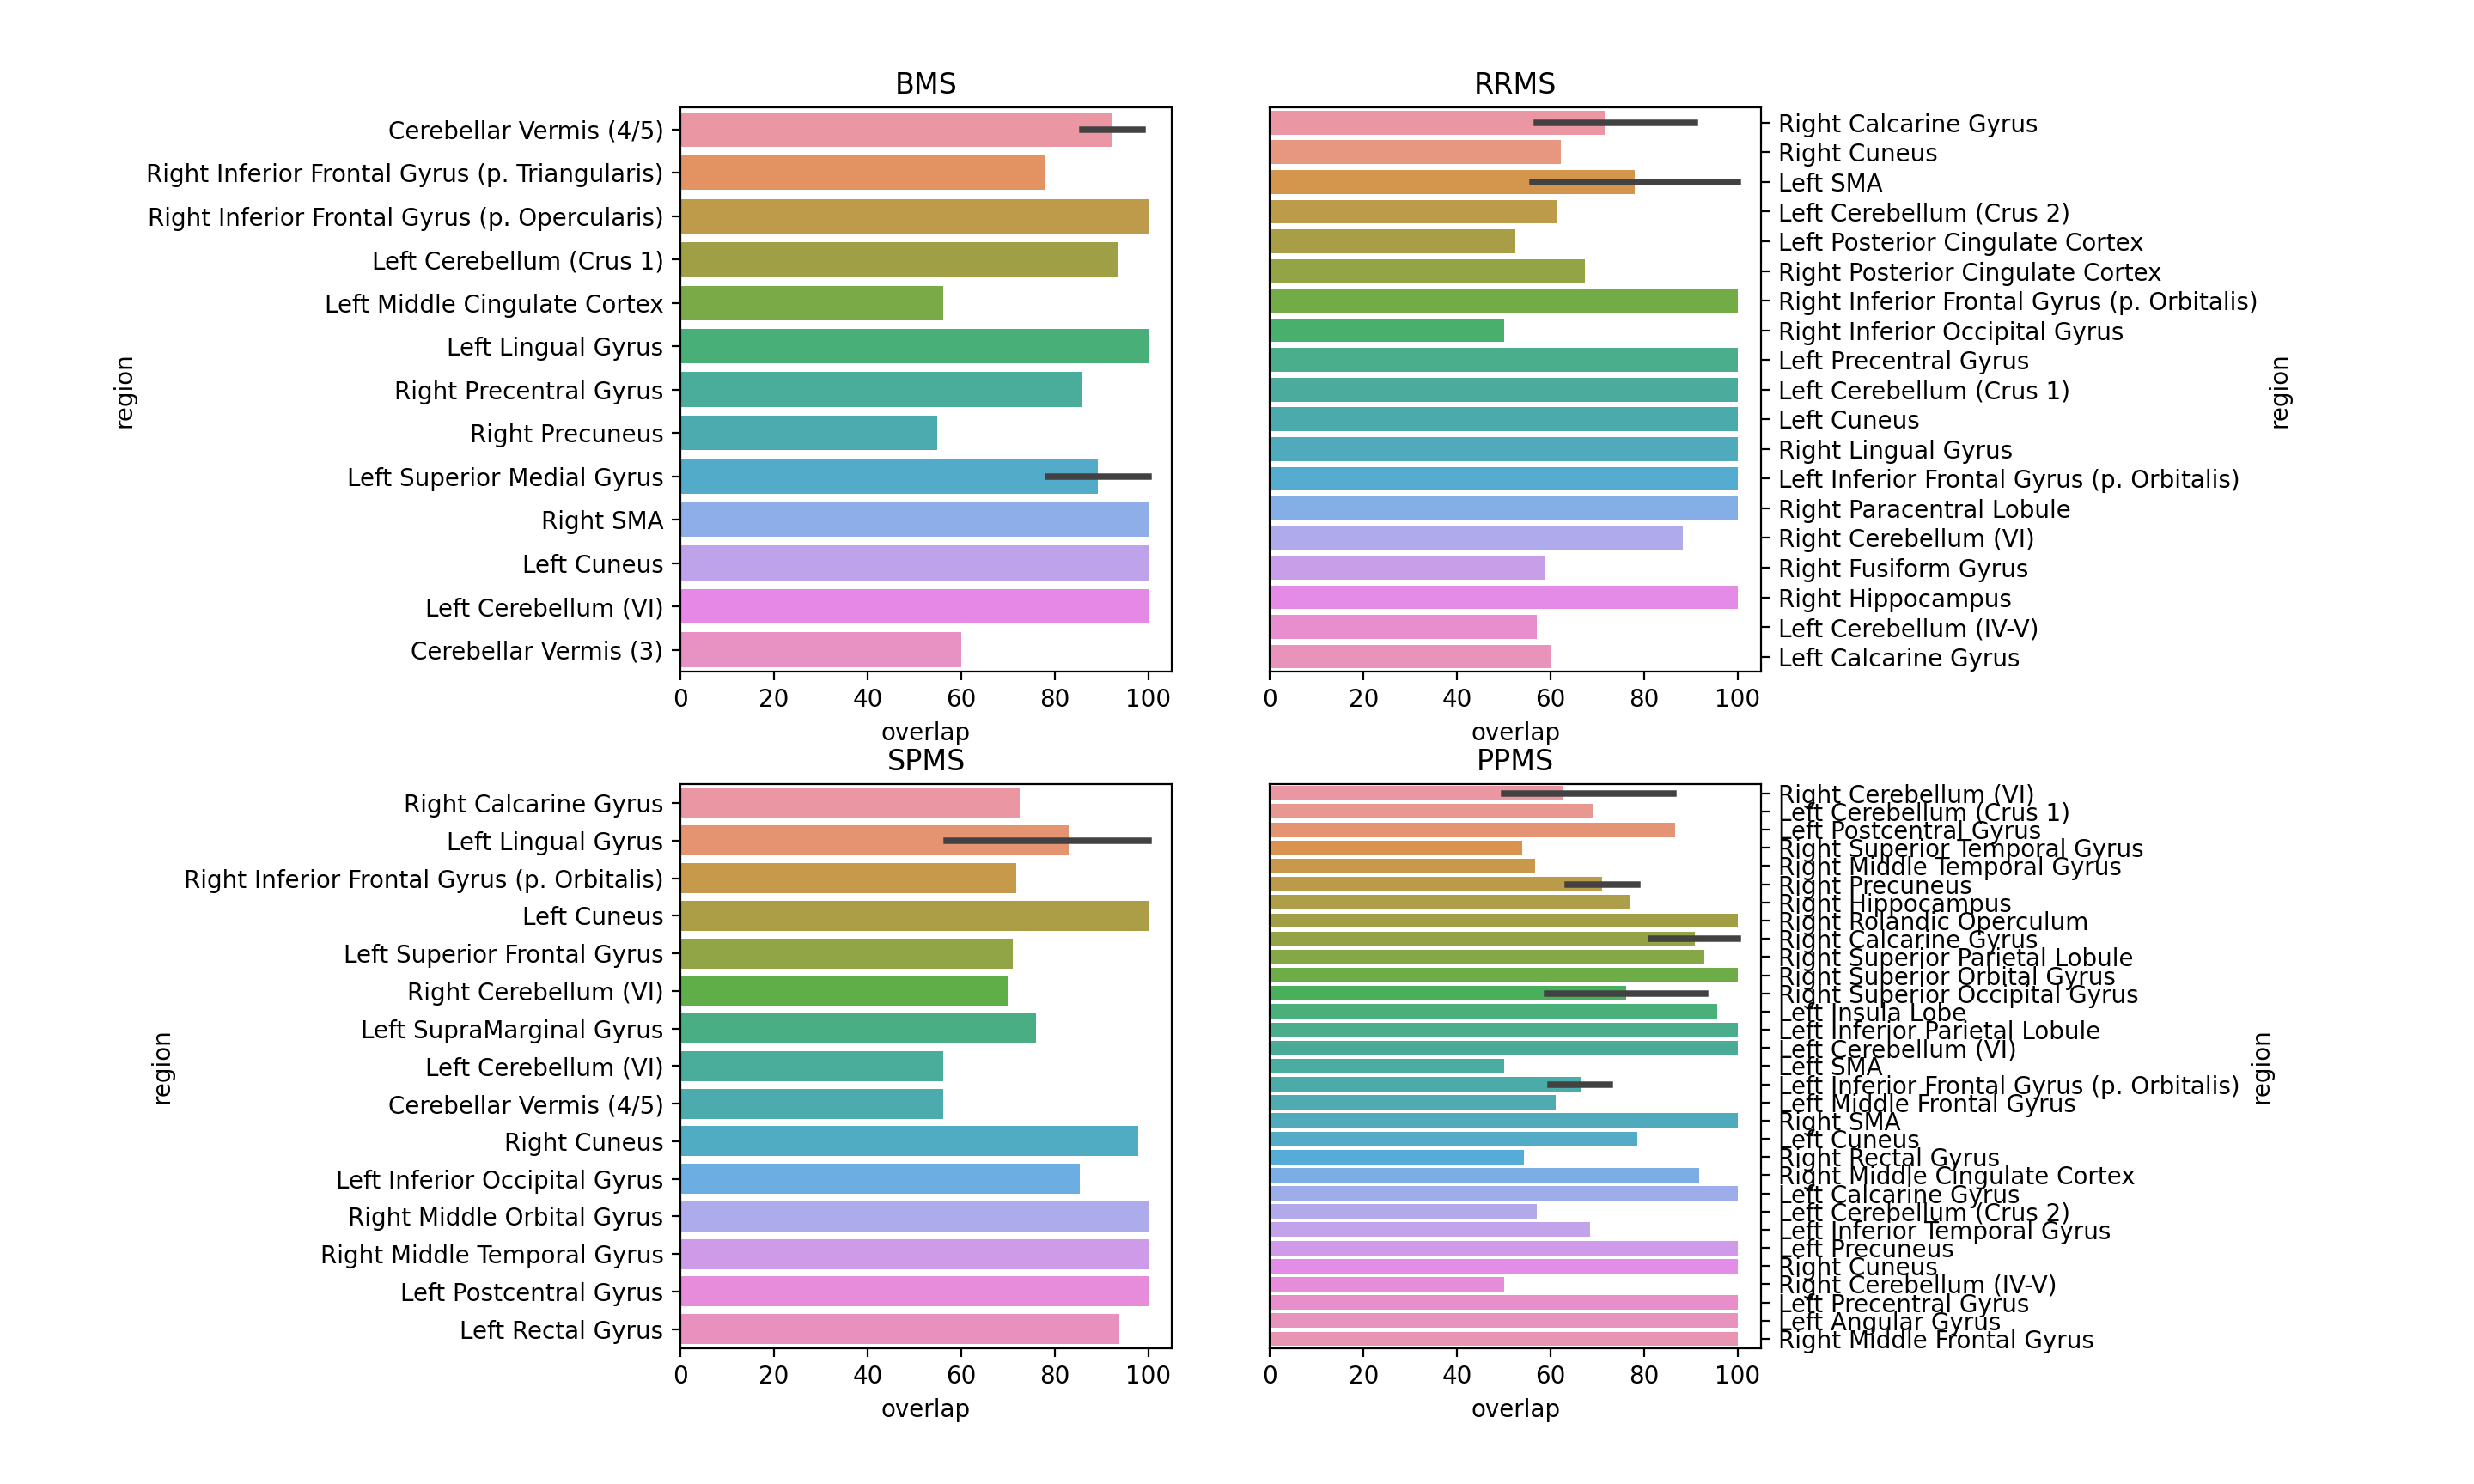
Figure 3. The mean percent overlap of clusters with anatomical regions labeled in the N27 Atlas, by MS subtype. The percent overlap is defined as the number of voxels within a cluster that overlap with an anatomical region, divided by the total number of number of voxels in the cluster. Error bars represent the 95% confidence interval, calculated only for regions with more than one cluster.
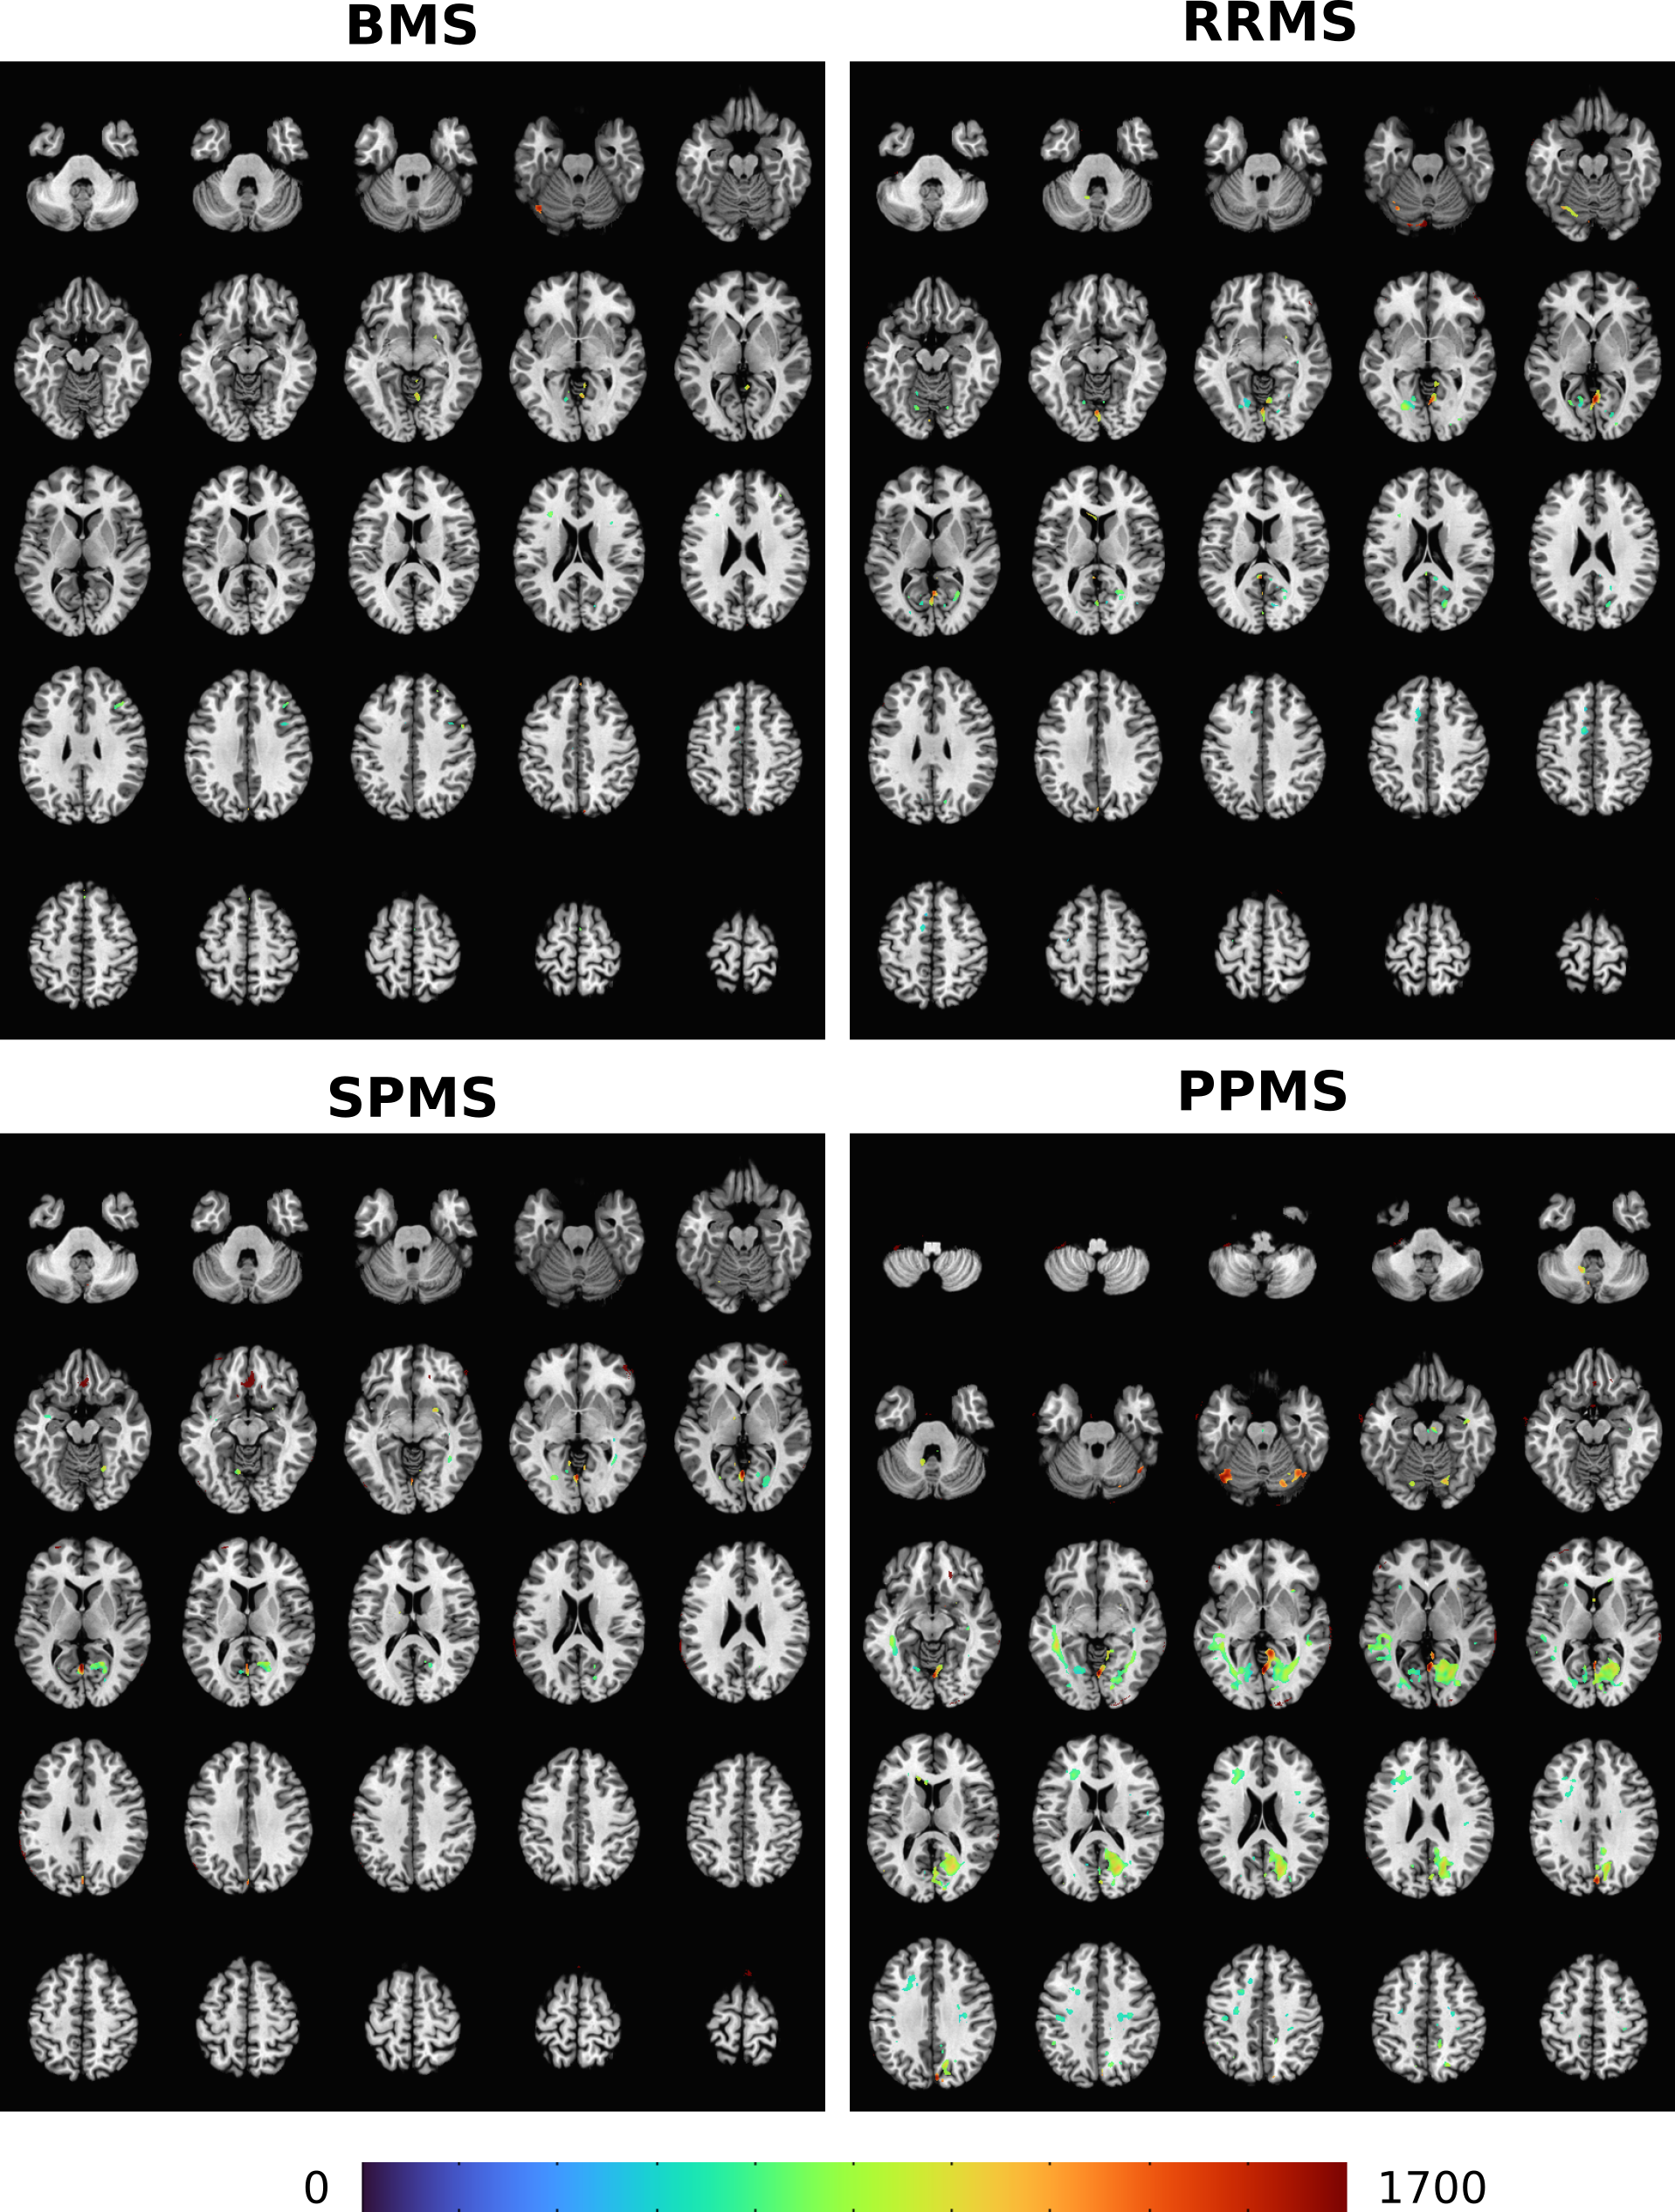
Figure 2. Montages of clusters identified by thresholding the mean difference in SWI intensity between each MS cohort (BMS, RRMS, SPMS, PPMS) and the control group. The clusters are overlain on to the N27 atlas. The colourmap corresponds to the square root of the mean sum of squares due to treatment effect. A significance threshold of p=0.001 was used.