1ETH Zurich and University of Zurich, Zurich, Switzerland, 2University Hospital Zurich and University of Zurich, Zurich, Switzerland
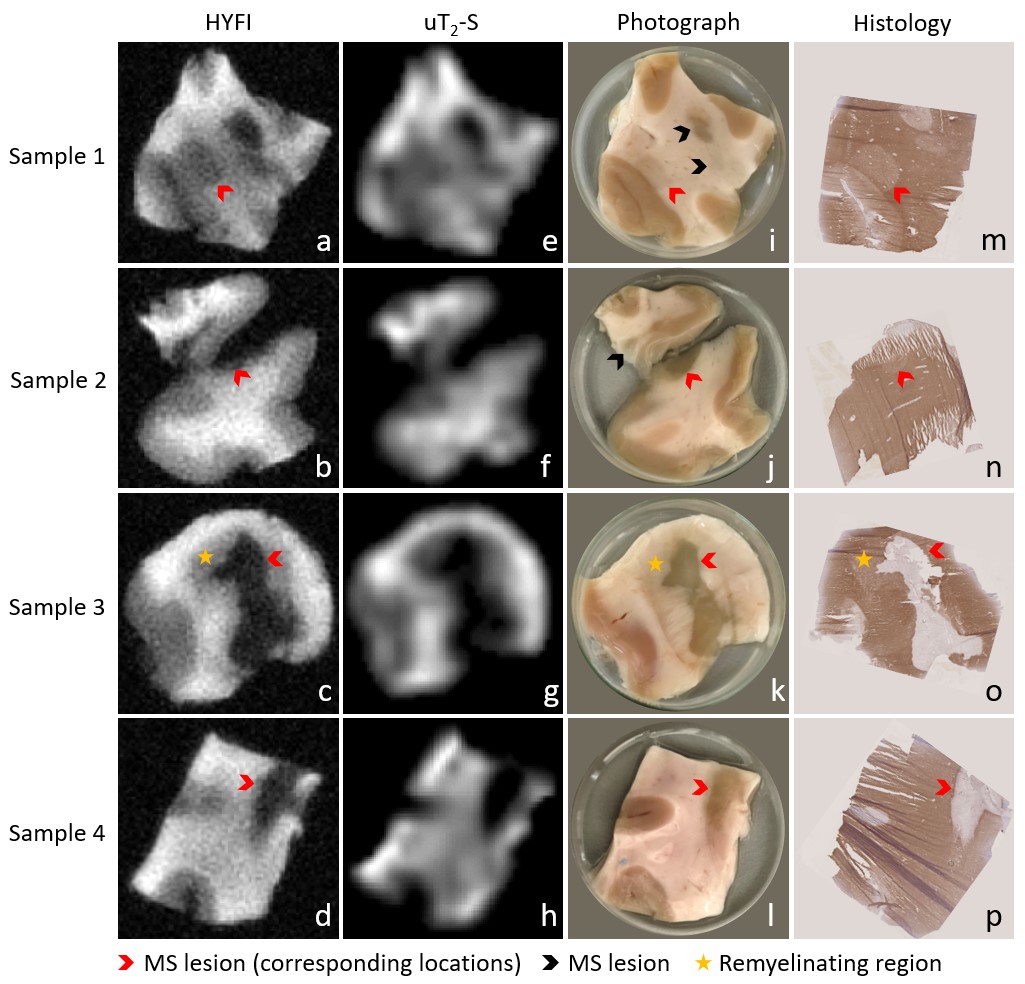
Figure 3: Image series showing the correlation between MRI results, photographs and histology for all samples. a-d) High-resolution HYFI images, e-h) amplitude maps of the uT2-S fit component, i-l) sample photographs, m-p) corresponding 10 µm cryosections with myelin staining using immunohistochemistry for MOG (brown) and haematoxylin counterstaining (purple). Note that sample 2 contains two tissue pieces (originally connected), but histology was only performed on the larger one.
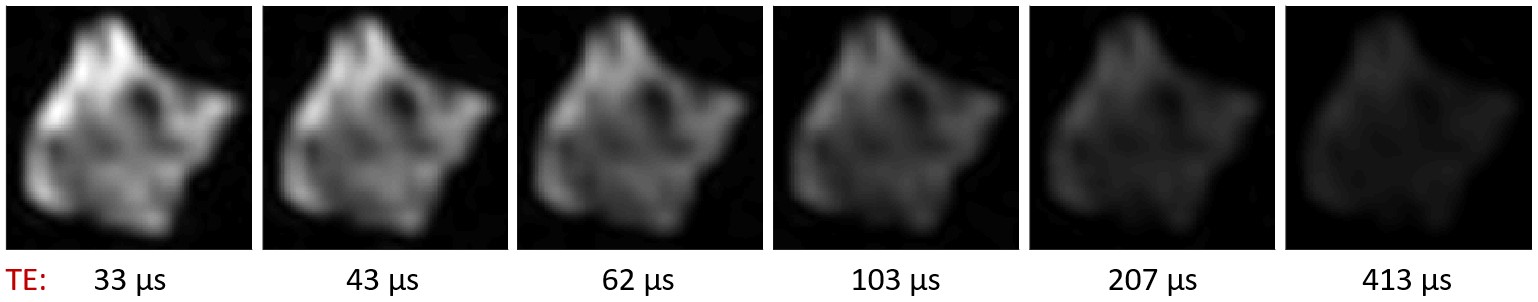
Figure 1: Time evolution of signal intensity in SPI images of human MS brain tissue after D2O exchange. Six of the fourteen images acquired for the SPI series of sample 1 are shown. The signal intensity drops as TE increases, and has all but vanished after 413 μs – a clear indication that the captured signal stems from tissues with T2 times of around a hundred microseconds at most.