Brendan Moloney1, Xin Li1, Eric M. Baker1, and Charles S. Springer1
1Advanced Imaging Research Center, Oregon Health & Science University, Portland, OR, United States
1Advanced Imaging Research Center, Oregon Health & Science University, Portland, OR, United States
Activity MRI [aMRI] simulates diffusion-weighted data with three metabolic and cytometric tissue properties: kio (s-1), the mean steady-state cellular water efflux rate constant [measuring cellular metabolic activity], r, the cell density (cells/μL), and V (pL), the average cell volume.
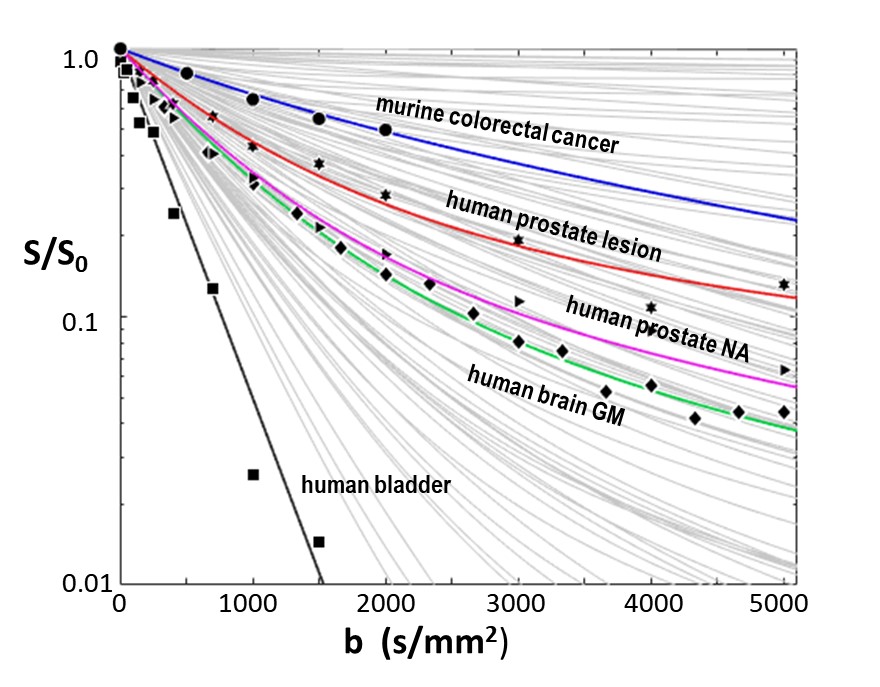
Figure 3. The light gray curves comprise samples of an aMRI library of >4000 simulated SDE b-space decays. Experimental data from murine colorectal tumor (circles),7 human prostate lesion (stars) and NA tissue (triangles), brain GM (diamonds), and bladder (squares) single voxels are shown. Different aMRI model kio, r, and V parameter sets produce the colored library simulated curves matching the disparate data. More importantly, the model parameters for each curve are in generally good agreement with measures from independent ex vivo studies of these tissues (Figure 4).
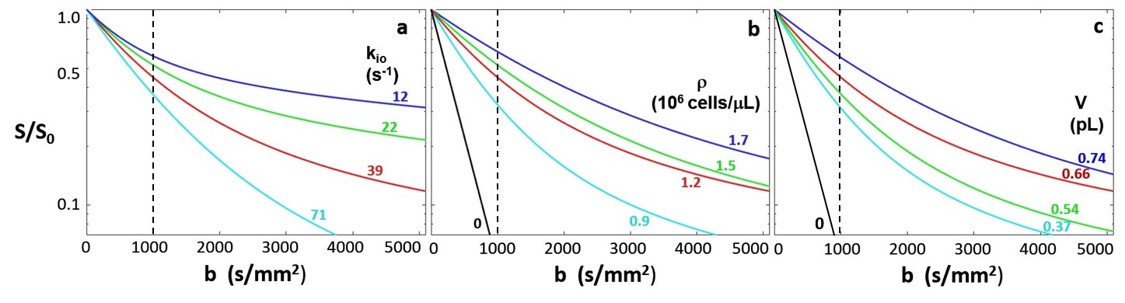
Figure 1. Simulated SDE decay curves showing the dependence on each of the aMRI parameters: the mean cellular water efflux rate constant kio (a), the cell density r (b), and the mean cell volume V (c), while the other two are held constant. Thus, for (a) r = 1,200,000 cells/μL, V = 0.54 pL, for (b) kio = 39 s-1, V = 0.54 pL, and for (c) kio = 39 s-1, r = 1,200,000 cells/μL. In these semi-log plots, all decays are curved [non‑Gaussian] except those for pure water: r = 0 in (b), and V = 0 in (c).