Joerg Peter Pfannmoeller1, Grant Addison Hartung1, Xiaojun Cheng2, Avery Berman1, David Boas2, and Jonathan Rizzo Polimeni1
1Athinoula A. Martinos Center for Biomedical Imaging, Massachusetts General Hospital, Charlestown, MA, United States, 2Neurophotonics Center, Boston University, Boston, MA, United States
1Athinoula A. Martinos Center for Biomedical Imaging, Massachusetts General Hospital, Charlestown, MA, United States, 2Neurophotonics Center, Boston University, Boston, MA, United States
We extended an existing framework of BOLD modeling based on biophysical simulations to incorporate viscoelastic properties of individual blood vessels and tissue, and use it to examine BOLD response nonlinearities to short-duration stimuli.

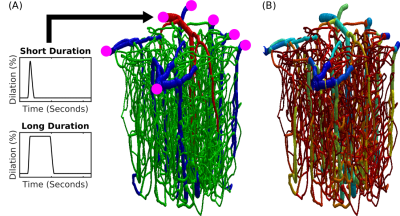
Fig.1 Realistic VAN model of mouse cortex. (A) Anatomical reconstruction of full vascular network (600 micron cube). Arteries (red), capillaries (green), veins (blue). The inputs and outputs to the network are indicated in magenta. The boundary conditions must be computed to emulate the behavior within the VAN as if it were connected to large feeding arteries and draining veins as it is in the brain. (B) The distribution of Young’s elasticity modulus indicating the characteristic difference between pial veins and the intra cortical diving veins and capillaries (logarithmic scale).

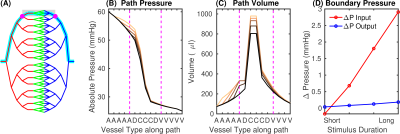
Fig.2 Determination of boundary conditions using a whole-brain stylistic VAN. (A) Vascular network for mouse brain (diving artery:vein ratio 1:3; arteries red, capillaries green, veins blue). Cyan indicates the path used for analysis, the area representing the realistic VAN is shaded, magenta dots show the VAN boundary nodes. (B) Pressure and (C) blood volume along the path in (A) for baseline and active conditions for short and long-duration stimuli. Magenta lines indicate the boundary nodes in (A). (D) Pressure increases at the boundary nodes for different stimulus durations.
