Yuan Le1, Andrew J. Fagan1, Jun Chen1, Eric G. Stinson2, Joel P. Felmlee1, Matthew C. Murphy1, Kevin J. Glaser1, Arvin Arani1, Phillip J. Rossman1, Stephan Kannengiesser3, Bradley D. Bolster, Jr.2, John Huston, III1, and Richard L. Ehman1
1Radiology, Mayo Clinic, Rochester, MN, United States, 2Siemens Medical Solutions USA, Inc., Malvern, PA, United States, 3Siemens Healthcare GmbH, Erlangen, Germany
1Radiology, Mayo Clinic, Rochester, MN, United States, 2Siemens Medical Solutions USA, Inc., Malvern, PA, United States, 3Siemens Healthcare GmbH, Erlangen, Germany
By comparing the MRE images acquired using a PVC phantom
at 7T vs. 3T, we found that the signal-to-noise ratio and the octahedral shear
strain based SNR were much higher, or close to double, at 7T compared with 3T. The
stiffness values were very close between the two field strengths.
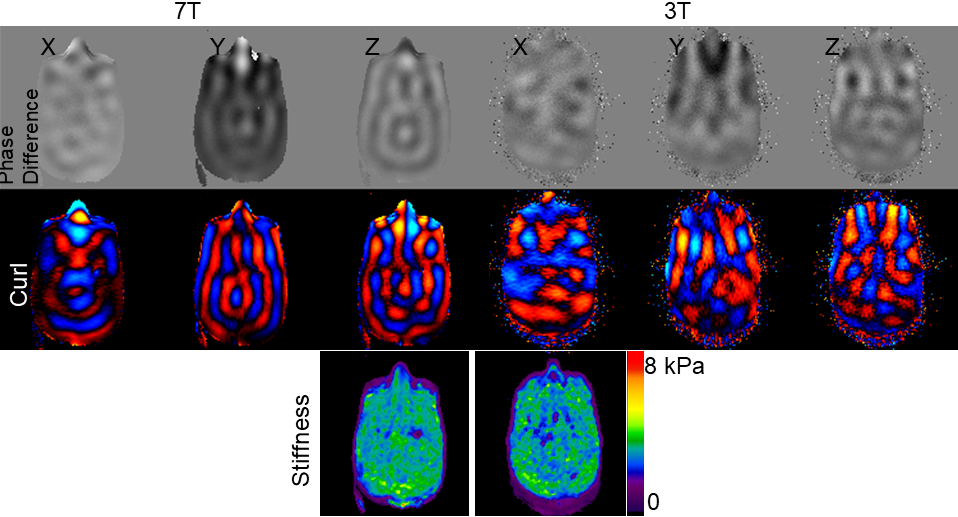
Figure 3. Wave images, curl maps and stiffness maps at 7T and 3T.
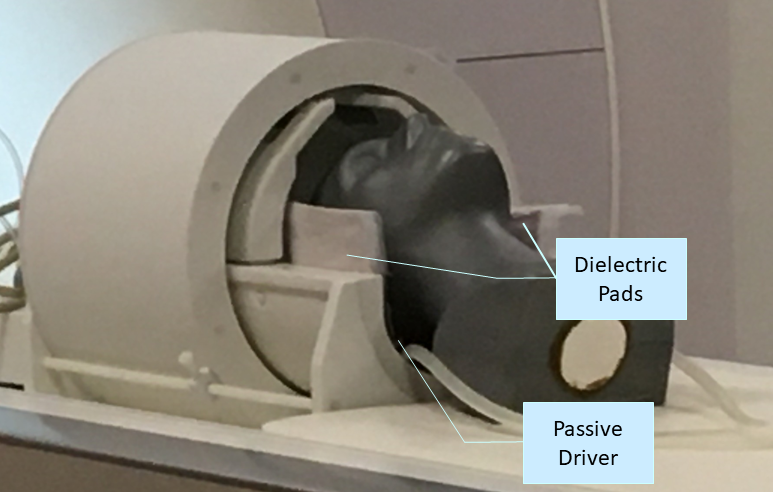
Figure 1. PVC head phantom and the setup of the MRE test.