Ludger Starke1, Thoralf Niendorf1, and Sonia Waiczies1
1Berlin Ultrahigh Field Facility (B.U.F.F.), Max Delbrück Center for Molecular Medicine in the Helmholtz Association, Berlin, Germany
1Berlin Ultrahigh Field Facility (B.U.F.F.), Max Delbrück Center for Molecular Medicine in the Helmholtz Association, Berlin, Germany
Labeling cells with 19F NPs enables
localization of inflammation and monitoring of cell therapy. Systematic overestimation
of signal intensities has been observed. We propose a statistical model which successfully
removes this bias and improves the reliability of quantitative 19F
MRI.
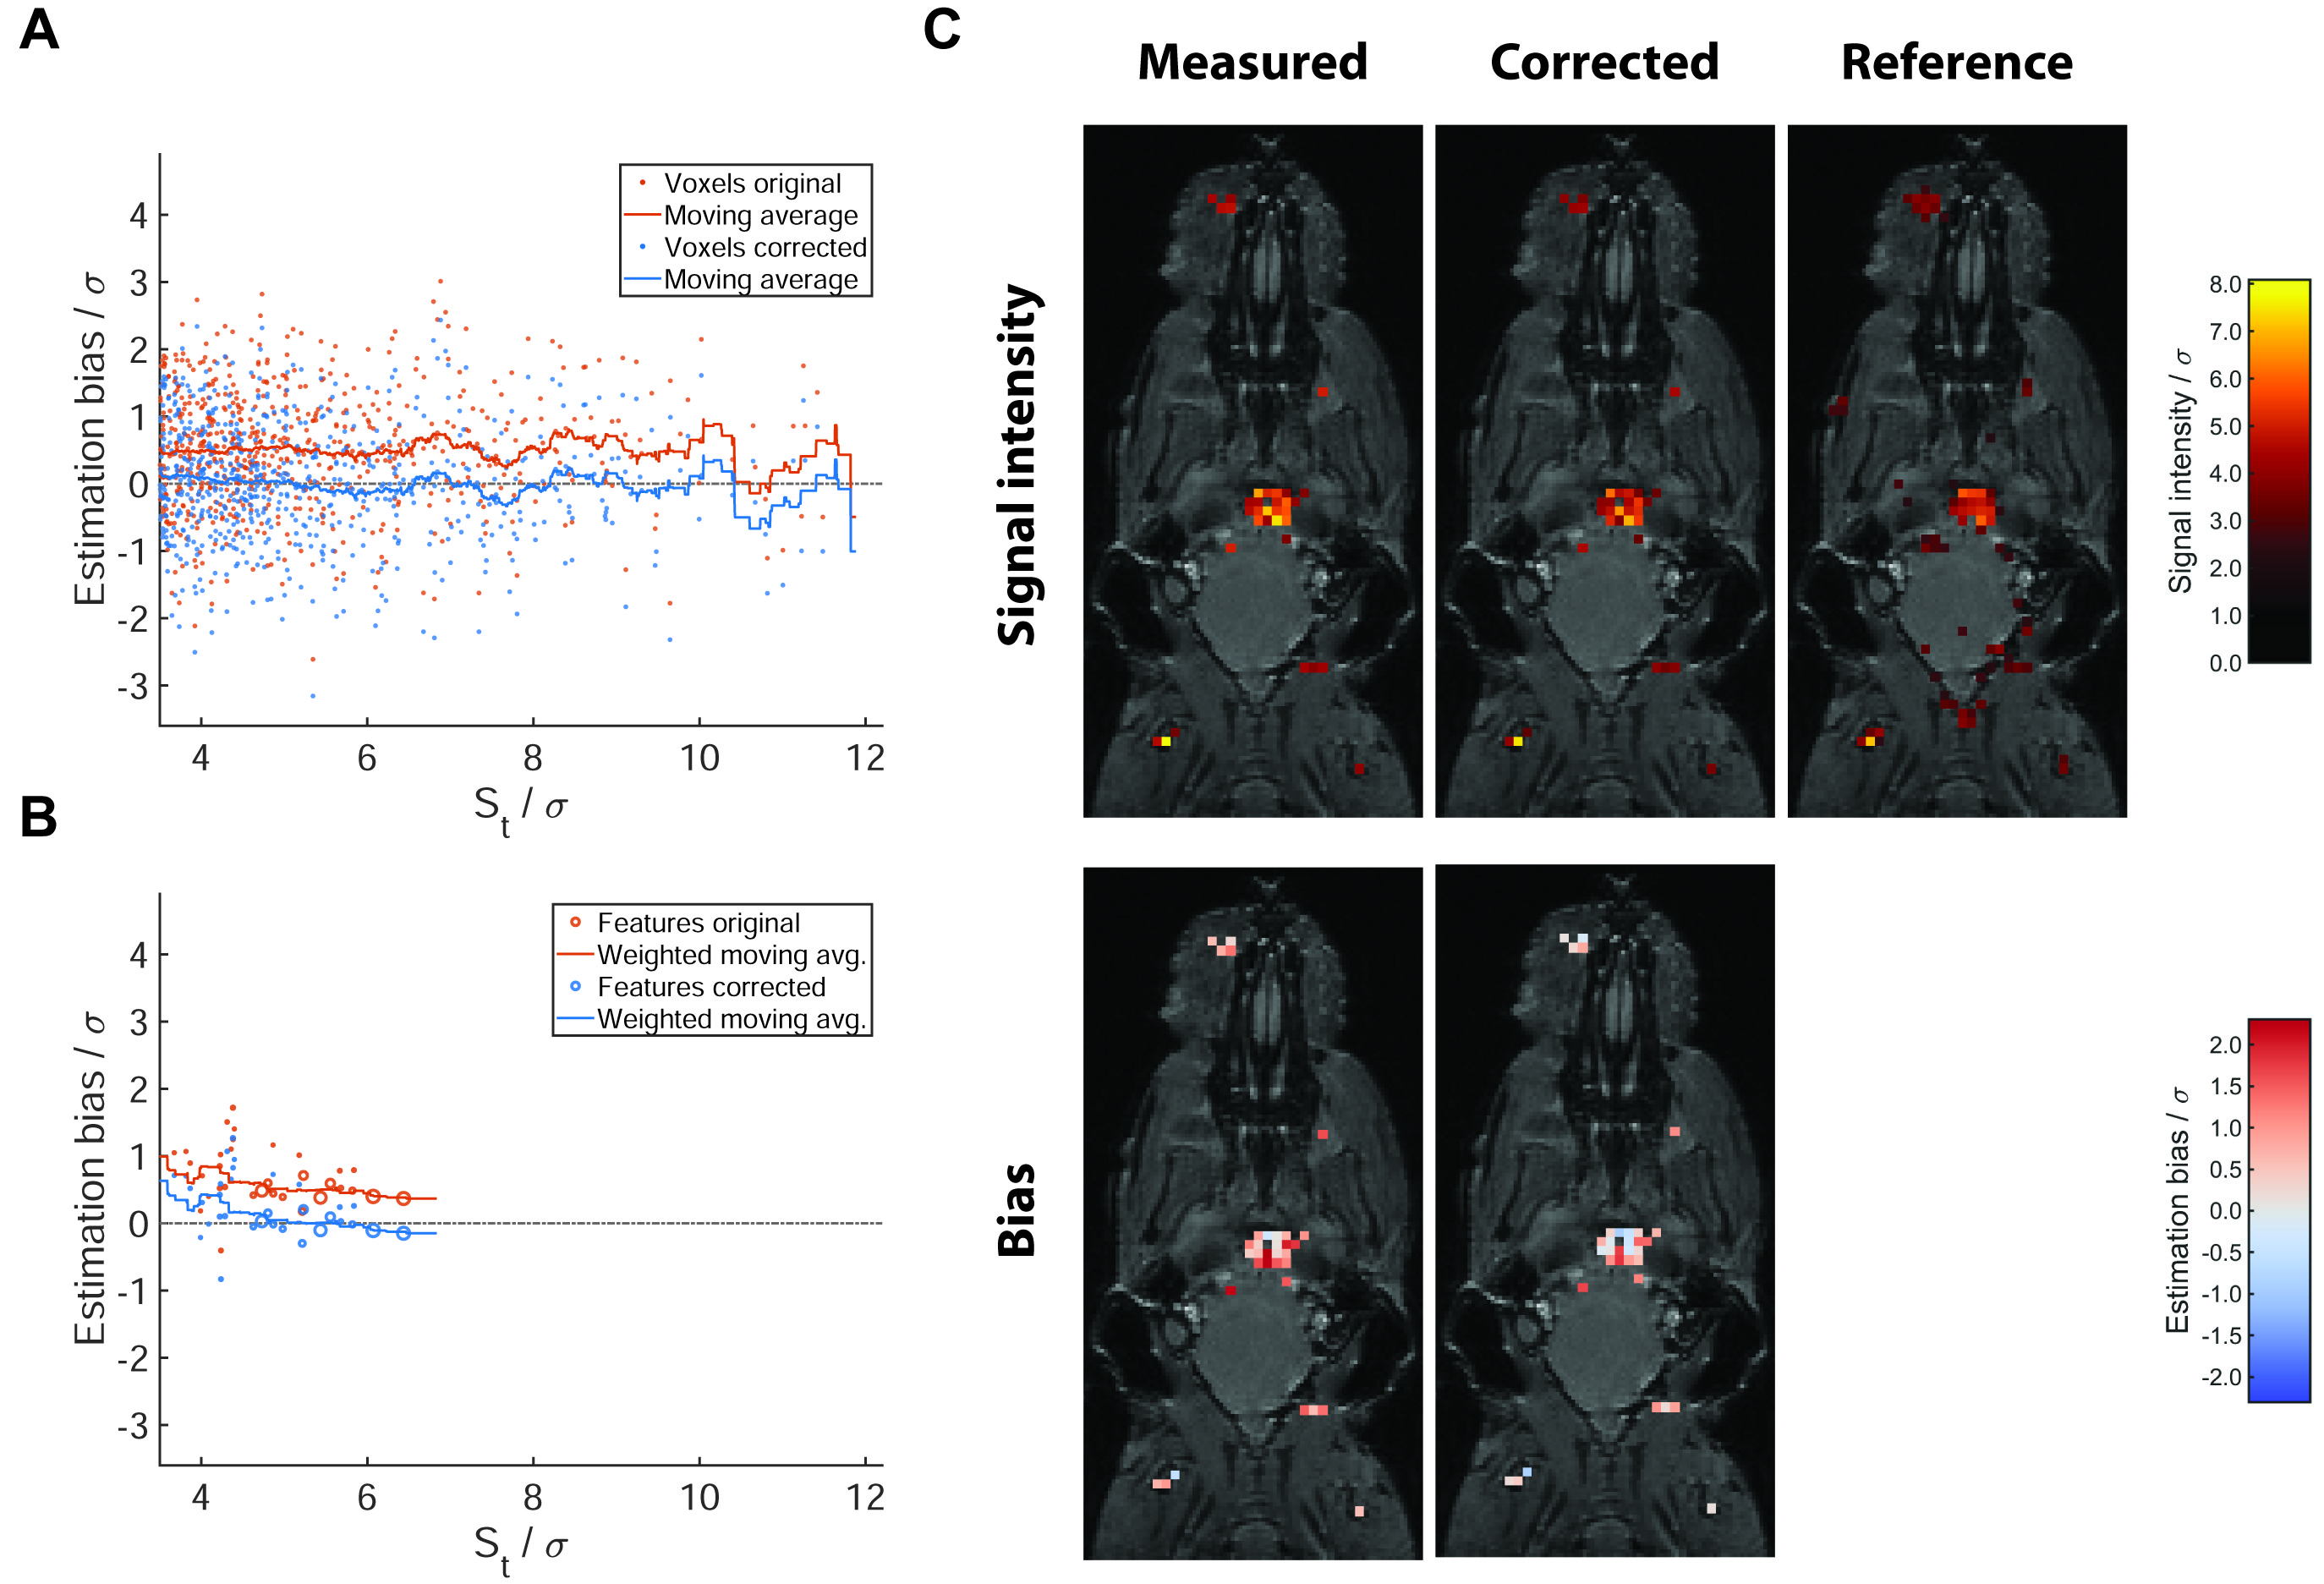
Example in
vivo dataset. Estimation bias including moving average for individual
voxels (A) and averaged over signal features (B). The area of markers is
proportional to the number of voxels in the feature. (C) Example slice from the
same 3D dataset. 19F-NPs
are taken up by inflammatory cells, which then accumulate at sites of inflammation. The first row shows 19F-MR
signal intensity for test data after RNBC (measured) and with model based bias
correction (corrected), as well as the reference data. The second line shows
estimation bias computed by comparison of test and reference data.
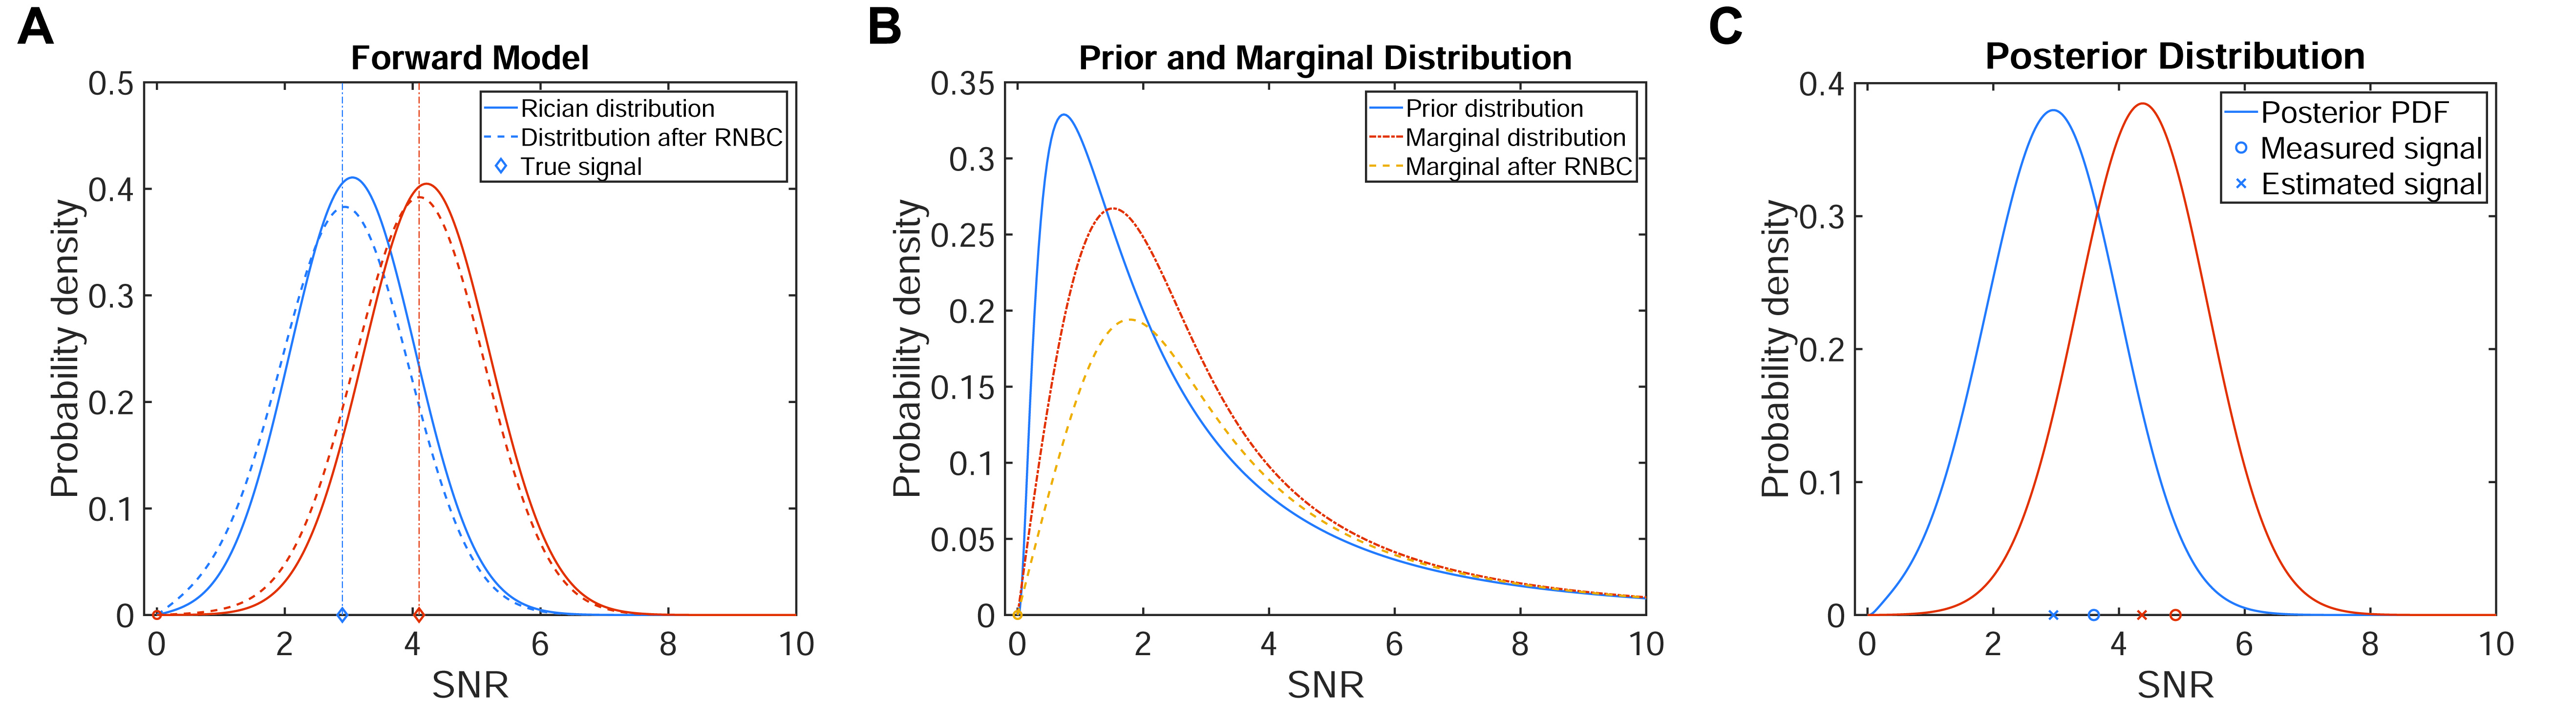
(A) Rician noise with known noise level is used
for the forward model. (B) The true signal intensities are assumed to be drawn
from a positively skewed probability distribution. Here a log-normal prior is shown.
The measured data is thus drawn from a marginal distribution computed by
integrating the product of forward model and prior distribution. The right
shift of probability mass for signal levels above the detection threshold leads
to the observed overestimation. (C) Posterior distributions for two measured
signal levels. The posterior mean gives the corrected signal
