David C. Hike1,2, Lauren C. Daley1,2, Frederick A Bagdasarian1,2, Shannon Helsper1,2, and Samuel Colles Grant1,2
1National High Magnetic Field Laboratory, Florida State University, Tallahassee, FL, United States, 2Chemical & Biomedical Engineering, FAMU-FSU College of Engineering, Tallahassee, FL, United States
1National High Magnetic Field Laboratory, Florida State University, Tallahassee, FL, United States, 2Chemical & Biomedical Engineering, FAMU-FSU College of Engineering, Tallahassee, FL, United States
This work utilizes resting
state fMRI and graph theory as methods for detecting functional changes following
a middle cerebral arterial occlusion model. Segmented EPI were acquired at 21.1
T out to 21 d post ischemia to assess resting state activation and correlated neural
regions.
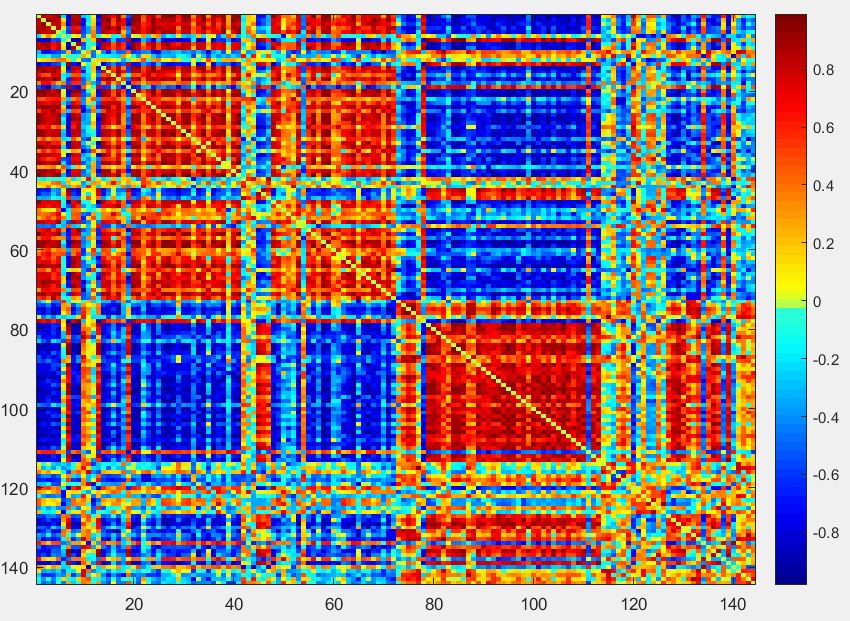
Figure 3: Correlation matrix of rs-fMRI data. This figure shows an adjacency matrix
of the 144 nodes where red indicates a positive correlation and blue indicates
a negative correlation. Nodes from 1-72 are located on the left side of the
brain while nodes 73-144 are located on the right side of the brain. Correlations
can be seen generally split by hemisphere. Positive correlations tend to appear
within hemispheres while negative correlations appear across hemispheres.
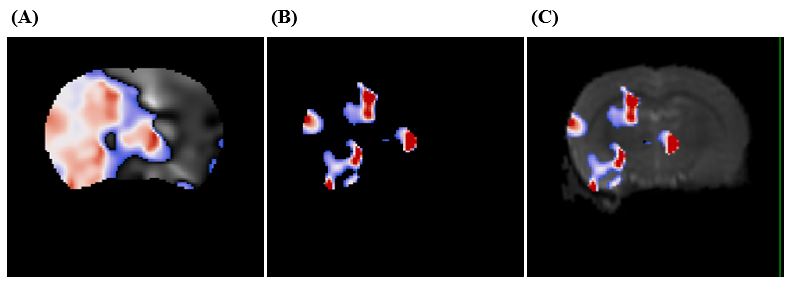
Figure
2: Activation map of
filtered and corrected data highlighting the areas of activation, informed by
the anatomical ROI identification. (A) all rs-fMRI signals detected (red
= higher intensity), whereas (B) displays only the areas of highest
intensity after removal of residual noise. (C) activation data overlaid
on original EPI with the areas of activation to identify anatomical regions of interest.